Tutoriales UBMI IFC
Recursos para la comunidad


Accessing and visualizing public Single-cell data using Allen Brain Cell Atlas
Use of the Allen Brain Map portal
The website of the Allen Brain Map, allows users to visualize, explore and analyze data from the public access databases and resources created by the Allen Institute
In this website we can access different types of data originated by various experimental approaches. Those datasets are separated by categories, and many of them contain interactive tools to plot and visualize their results, in this guide we show how to access to the Allen Brain Cell Atlas visualizer as well the one for the Mouse Patch-Seq data.
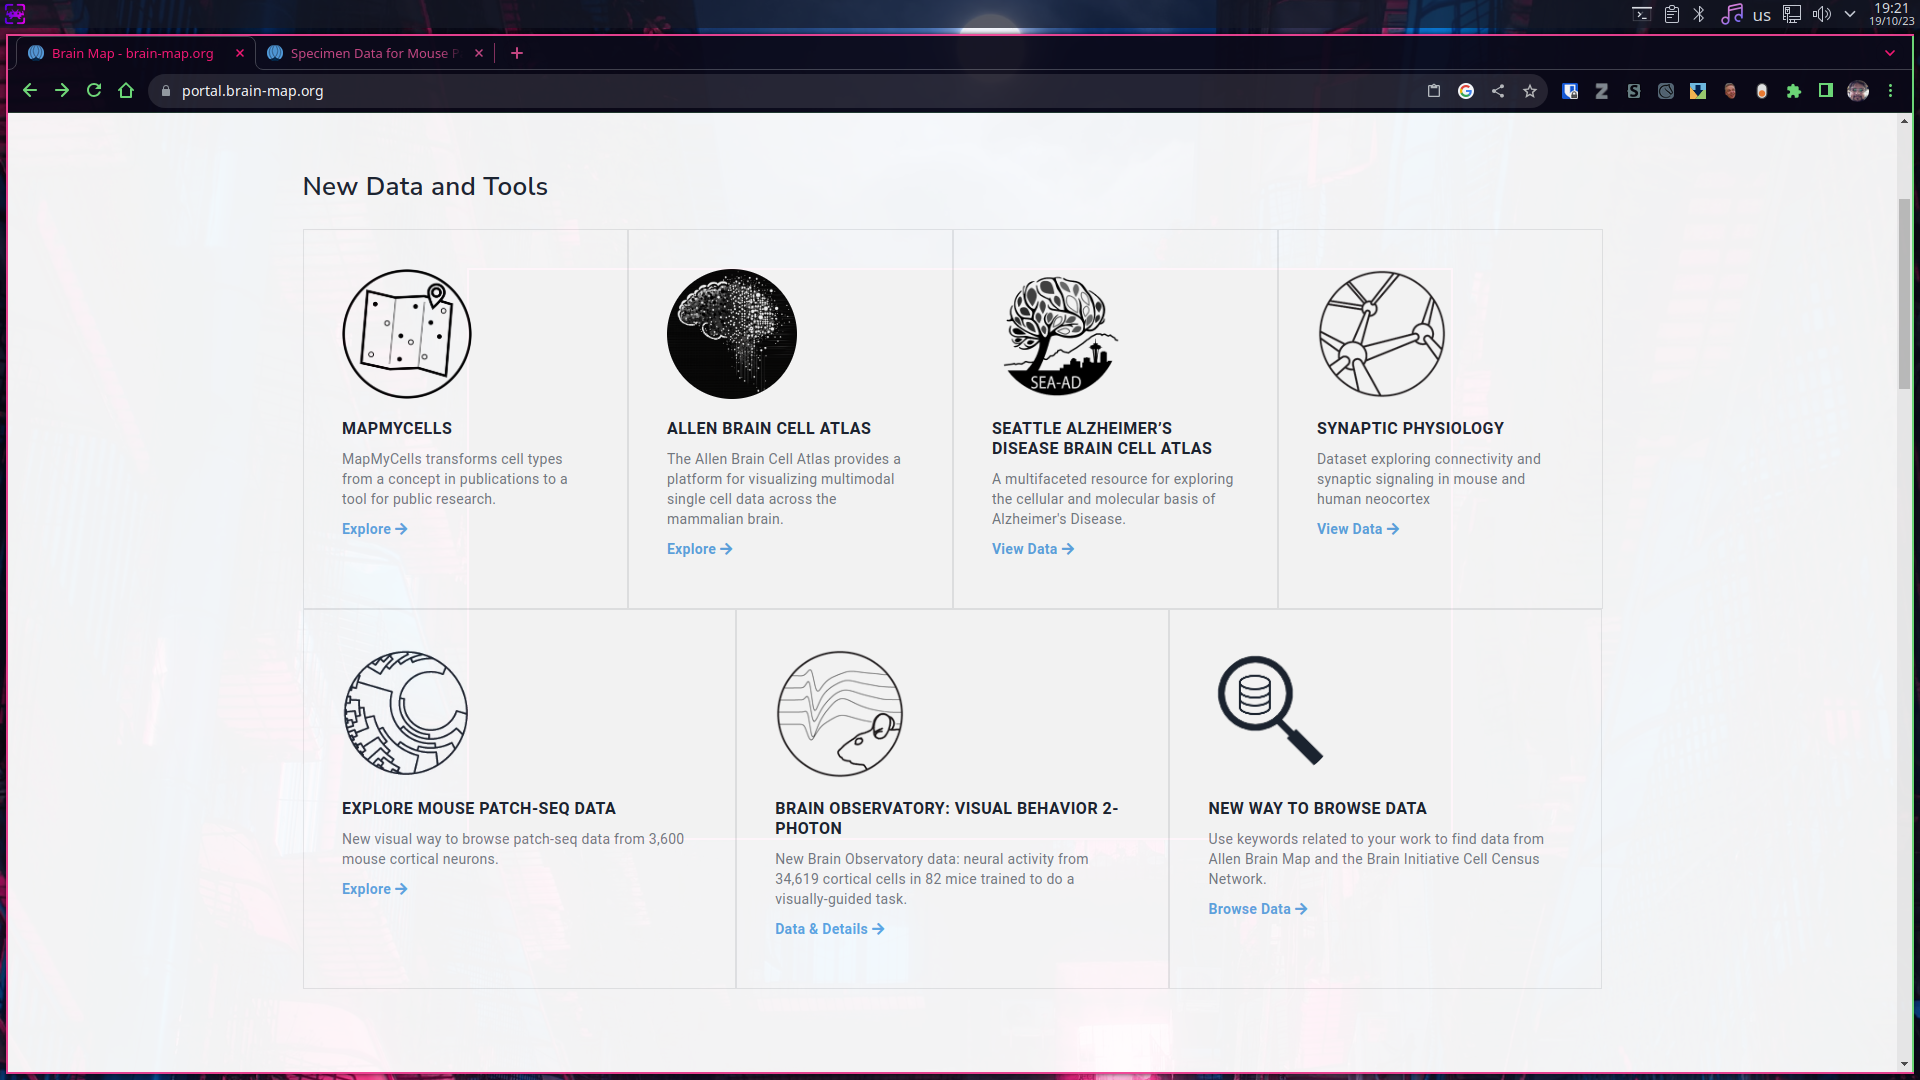
A good place to start is this webpage.
Exploring Single Cell transcriptomic data
The “Cell Types Database” contains electrophysological, morphological and transcriptomic data from individual cells from the brain of human and mouse individuals.
- To access transcriptomic data we can start by simply clicking into the “RNA-Seq Data” section.
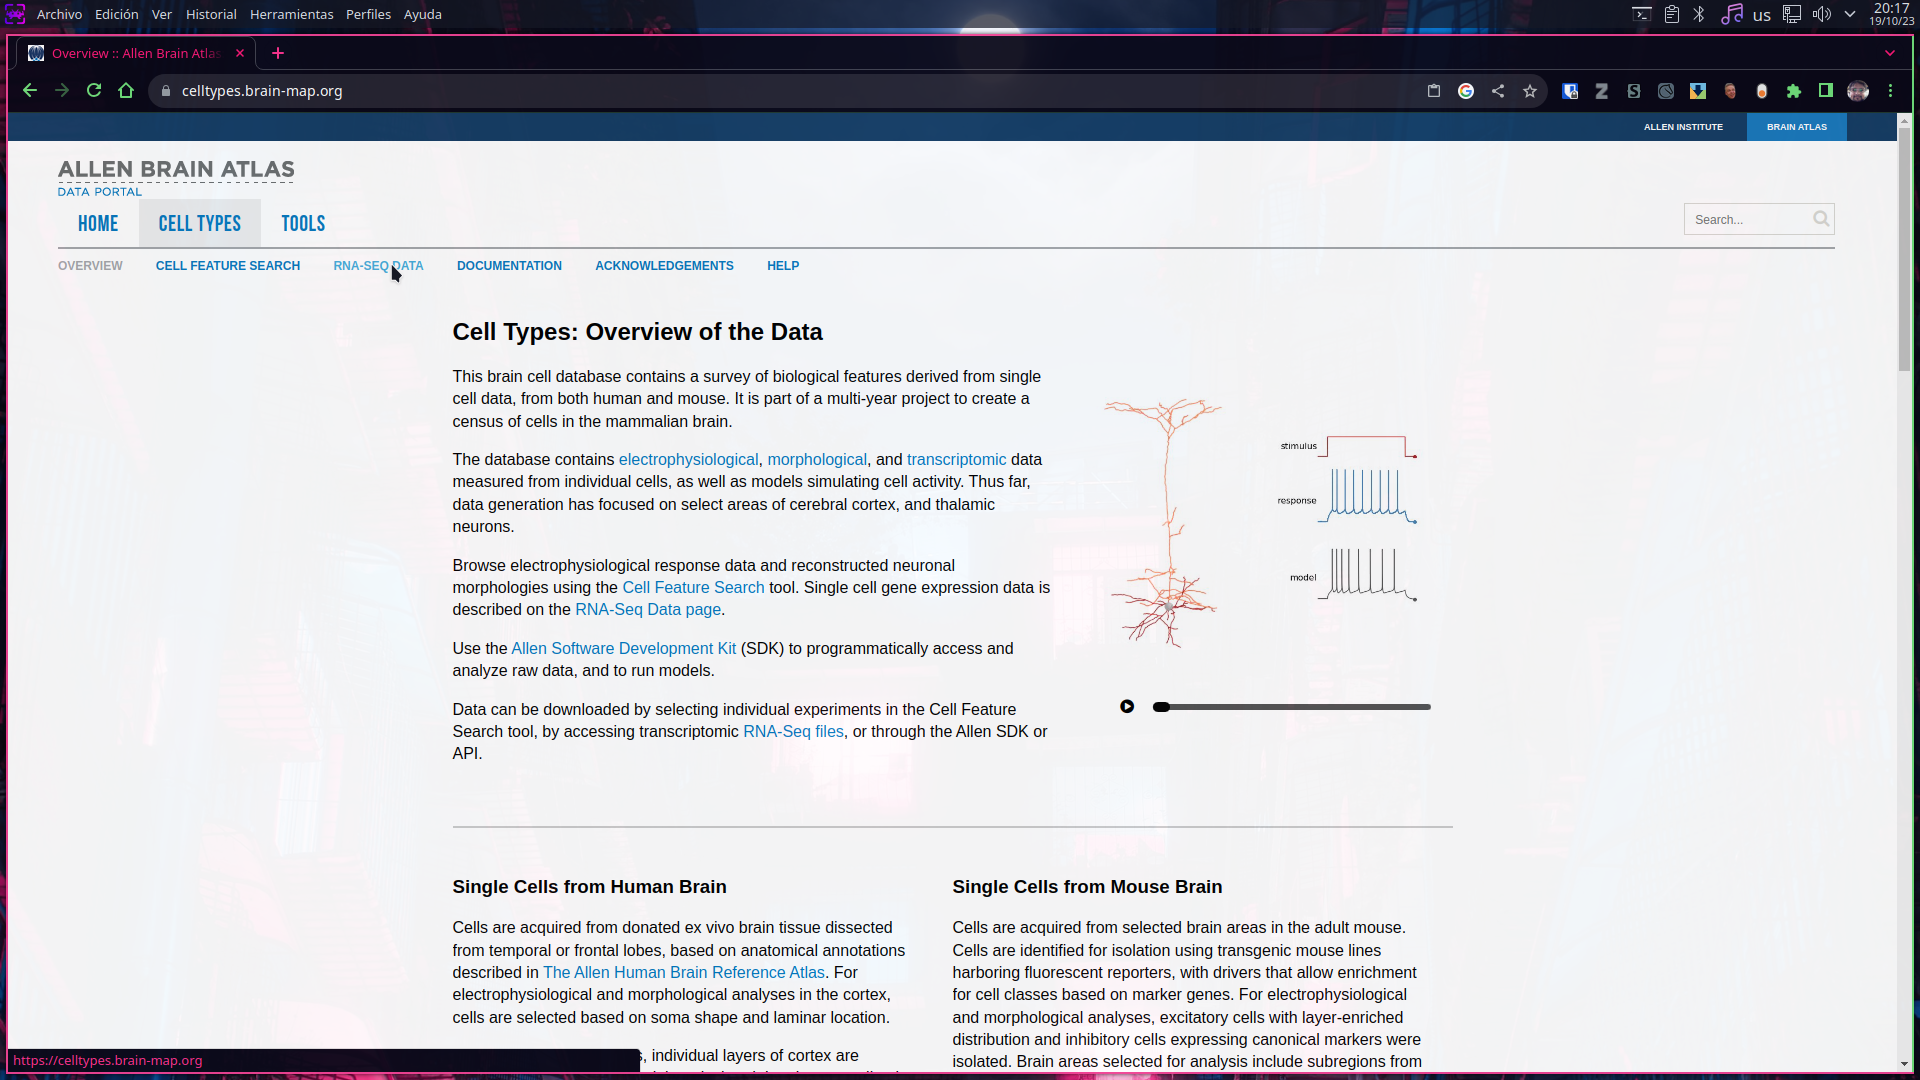
- Once open, the webpage will display the available datasets, as well important and interesting information about the experimental aproach.
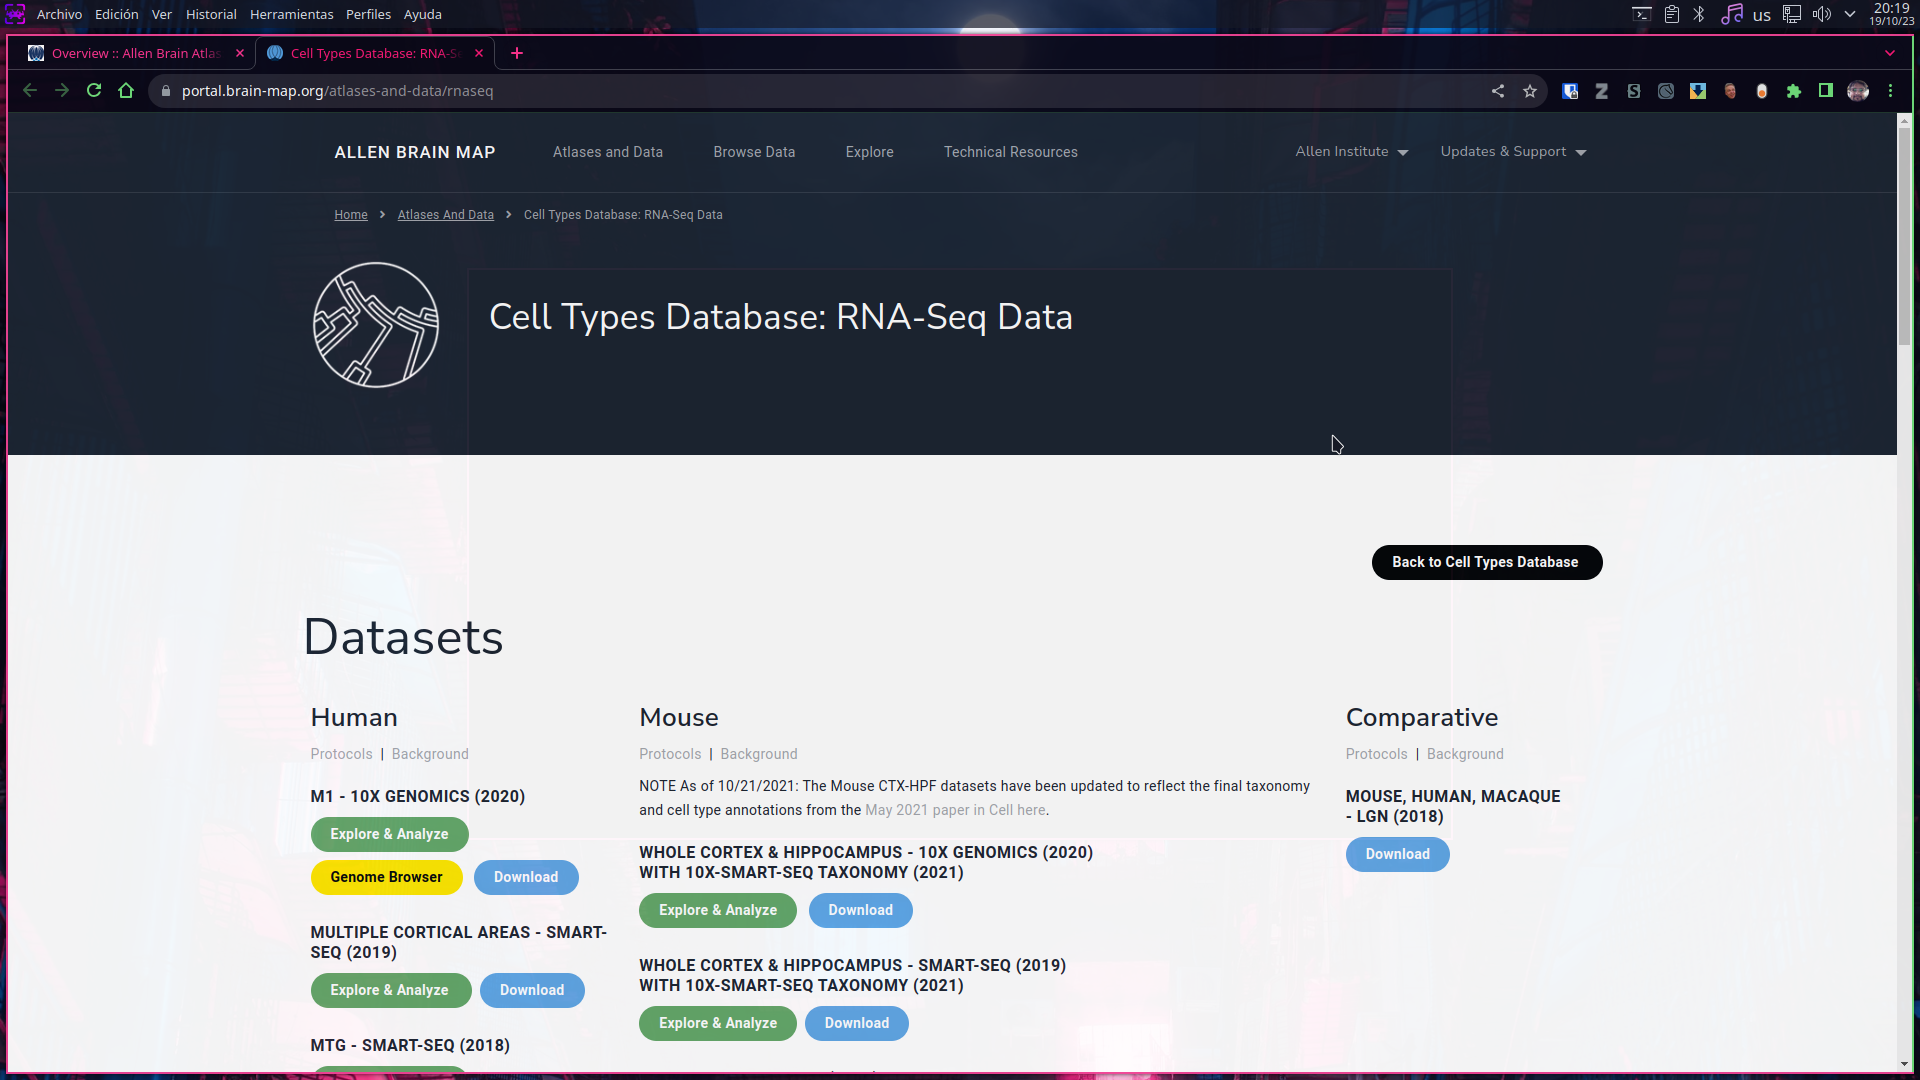

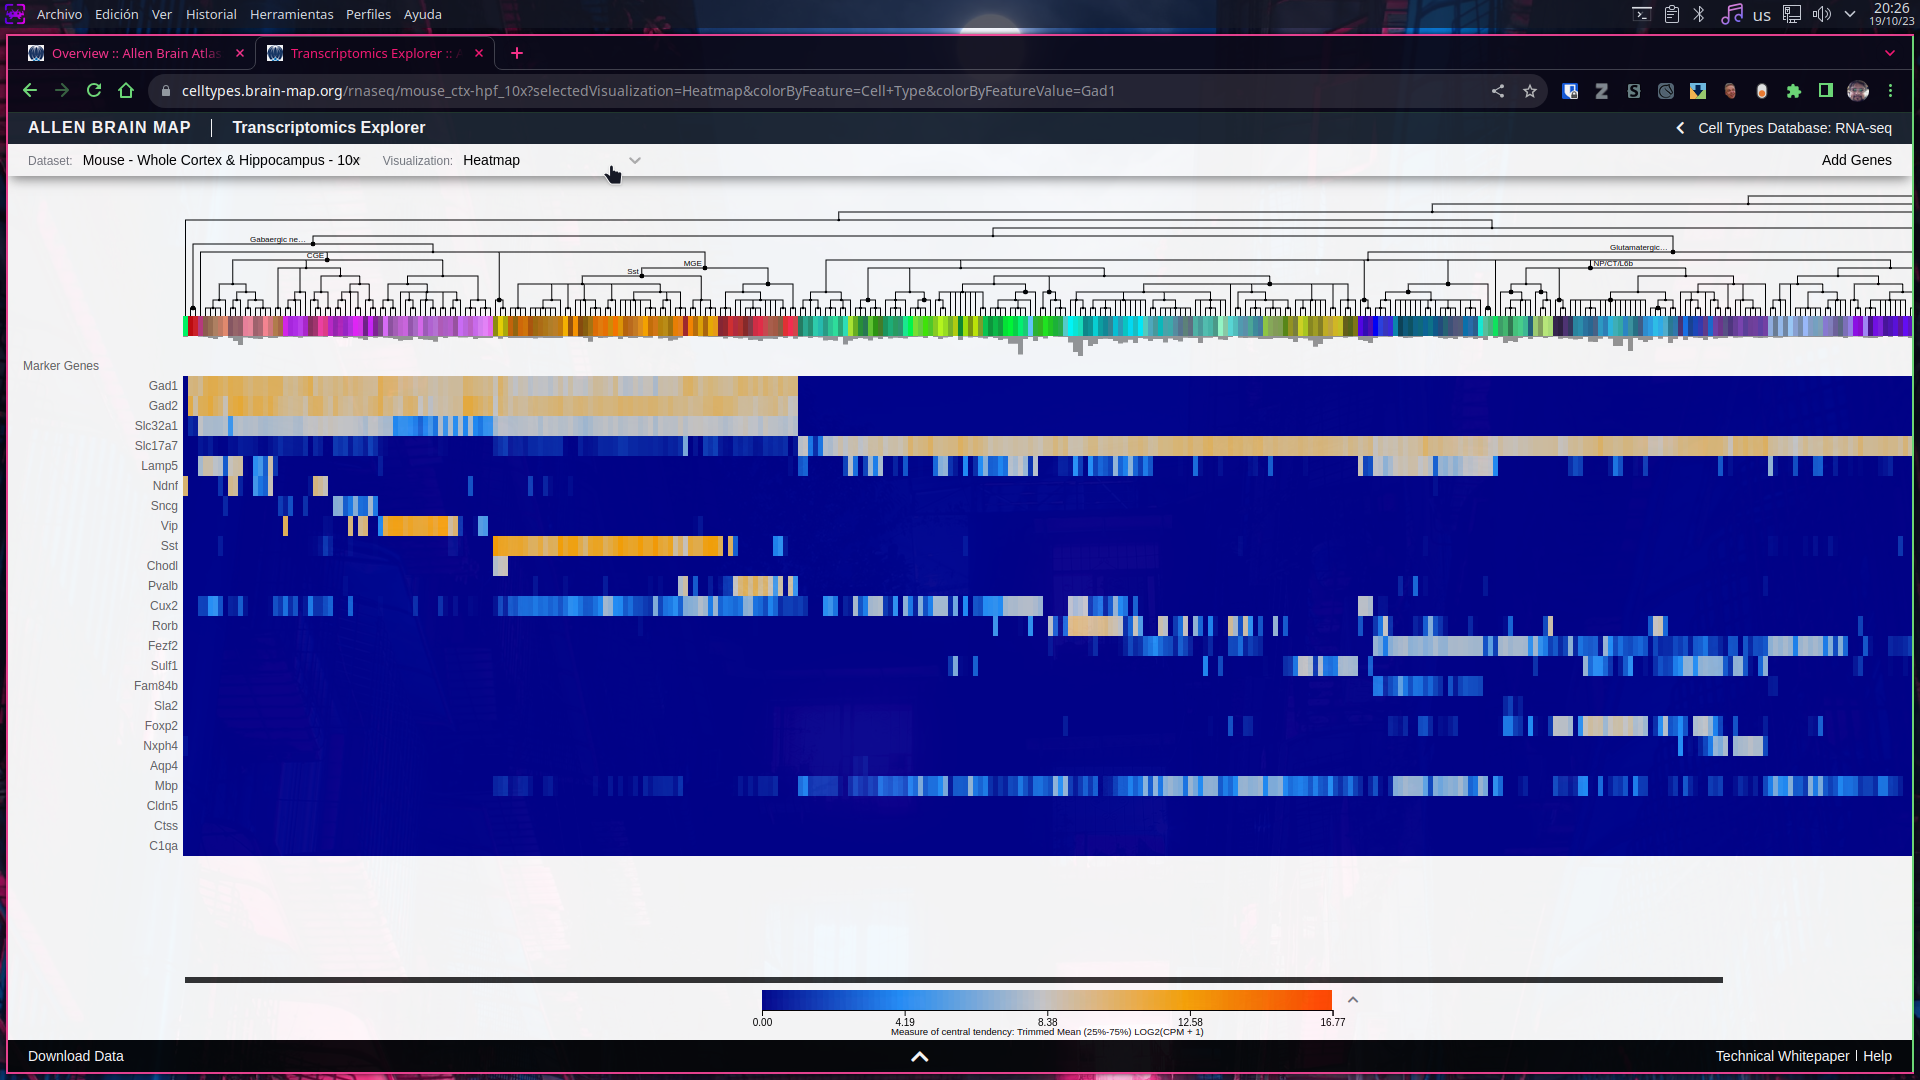
- By clicking into “Explore & Analyze” for each of the available datasets, an interactive viewer of the gene expression across the individual cells will display, known as the “Transcriptomics explorer”
Retrieving of Cell Types Database transcriptomic data
- Individual datasets can be fully or partially downloaded by clicking into the “Download” button for each available dataset.
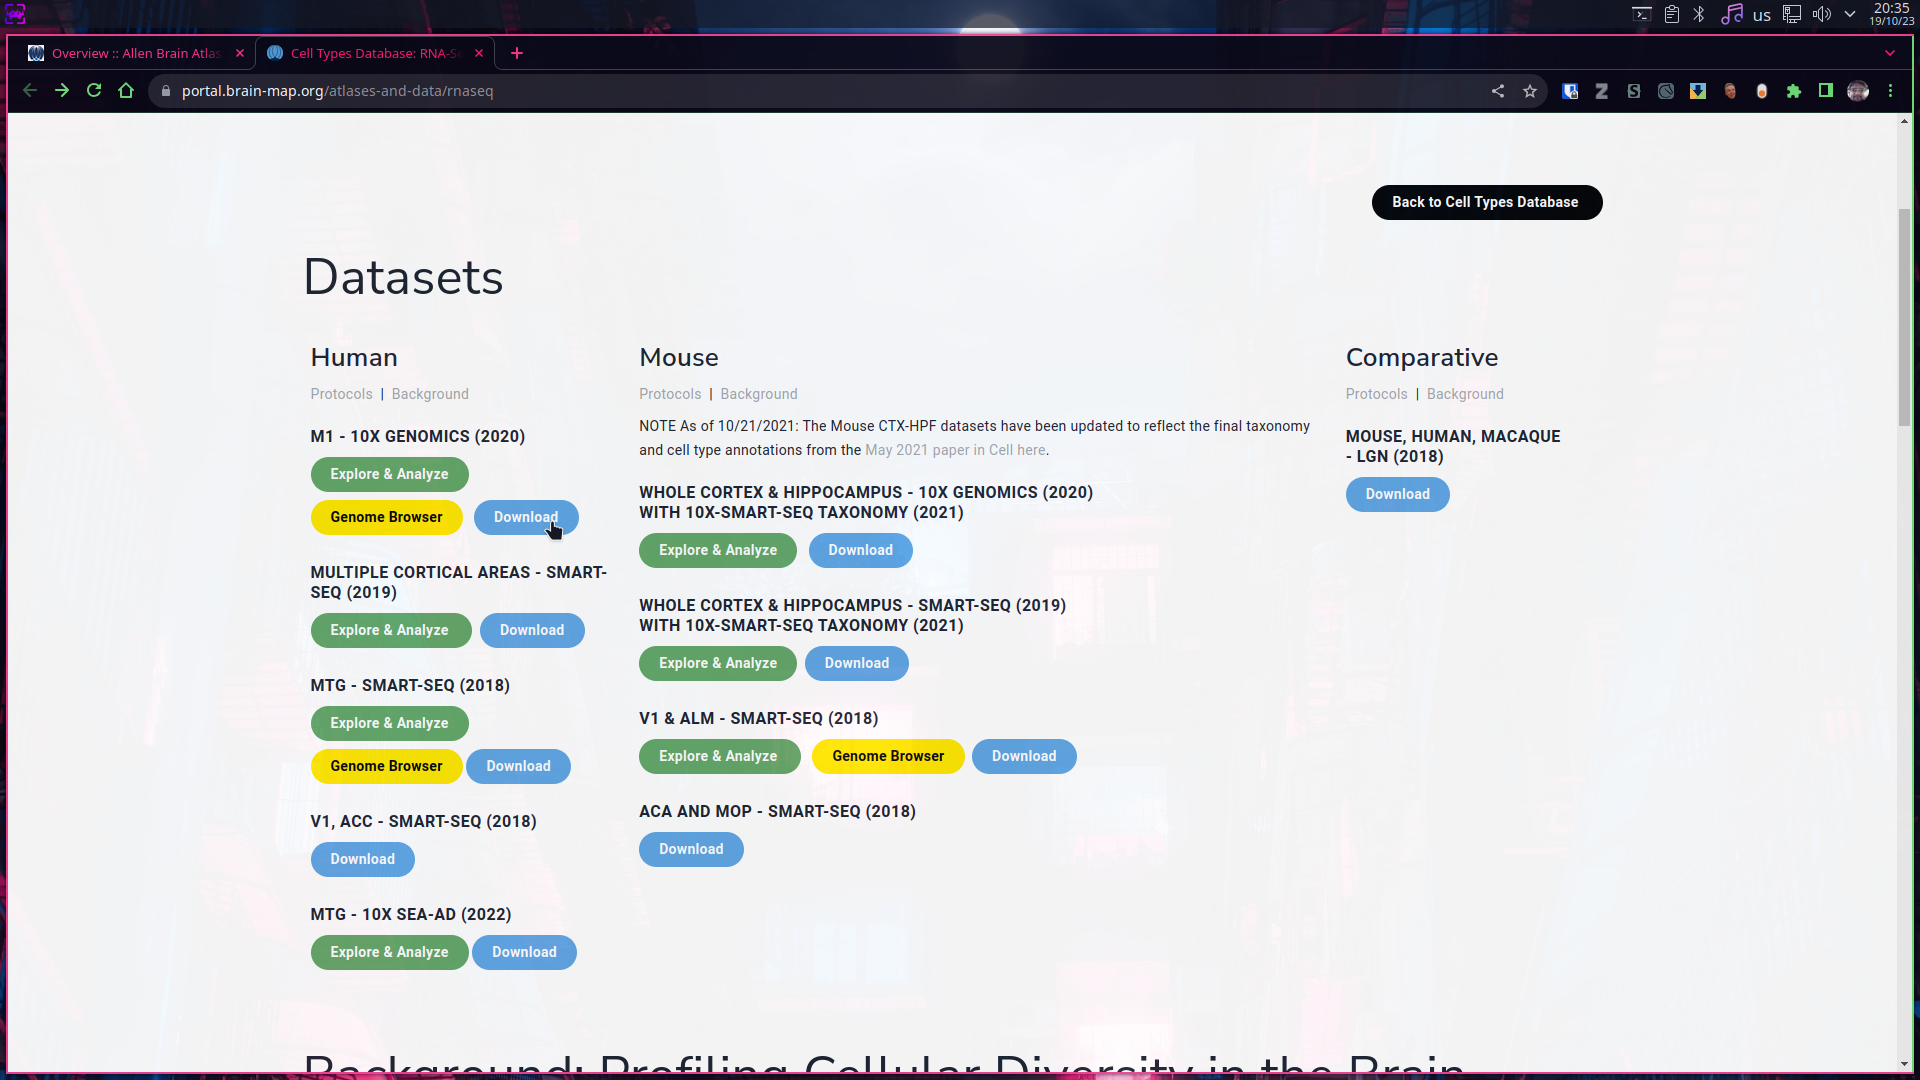
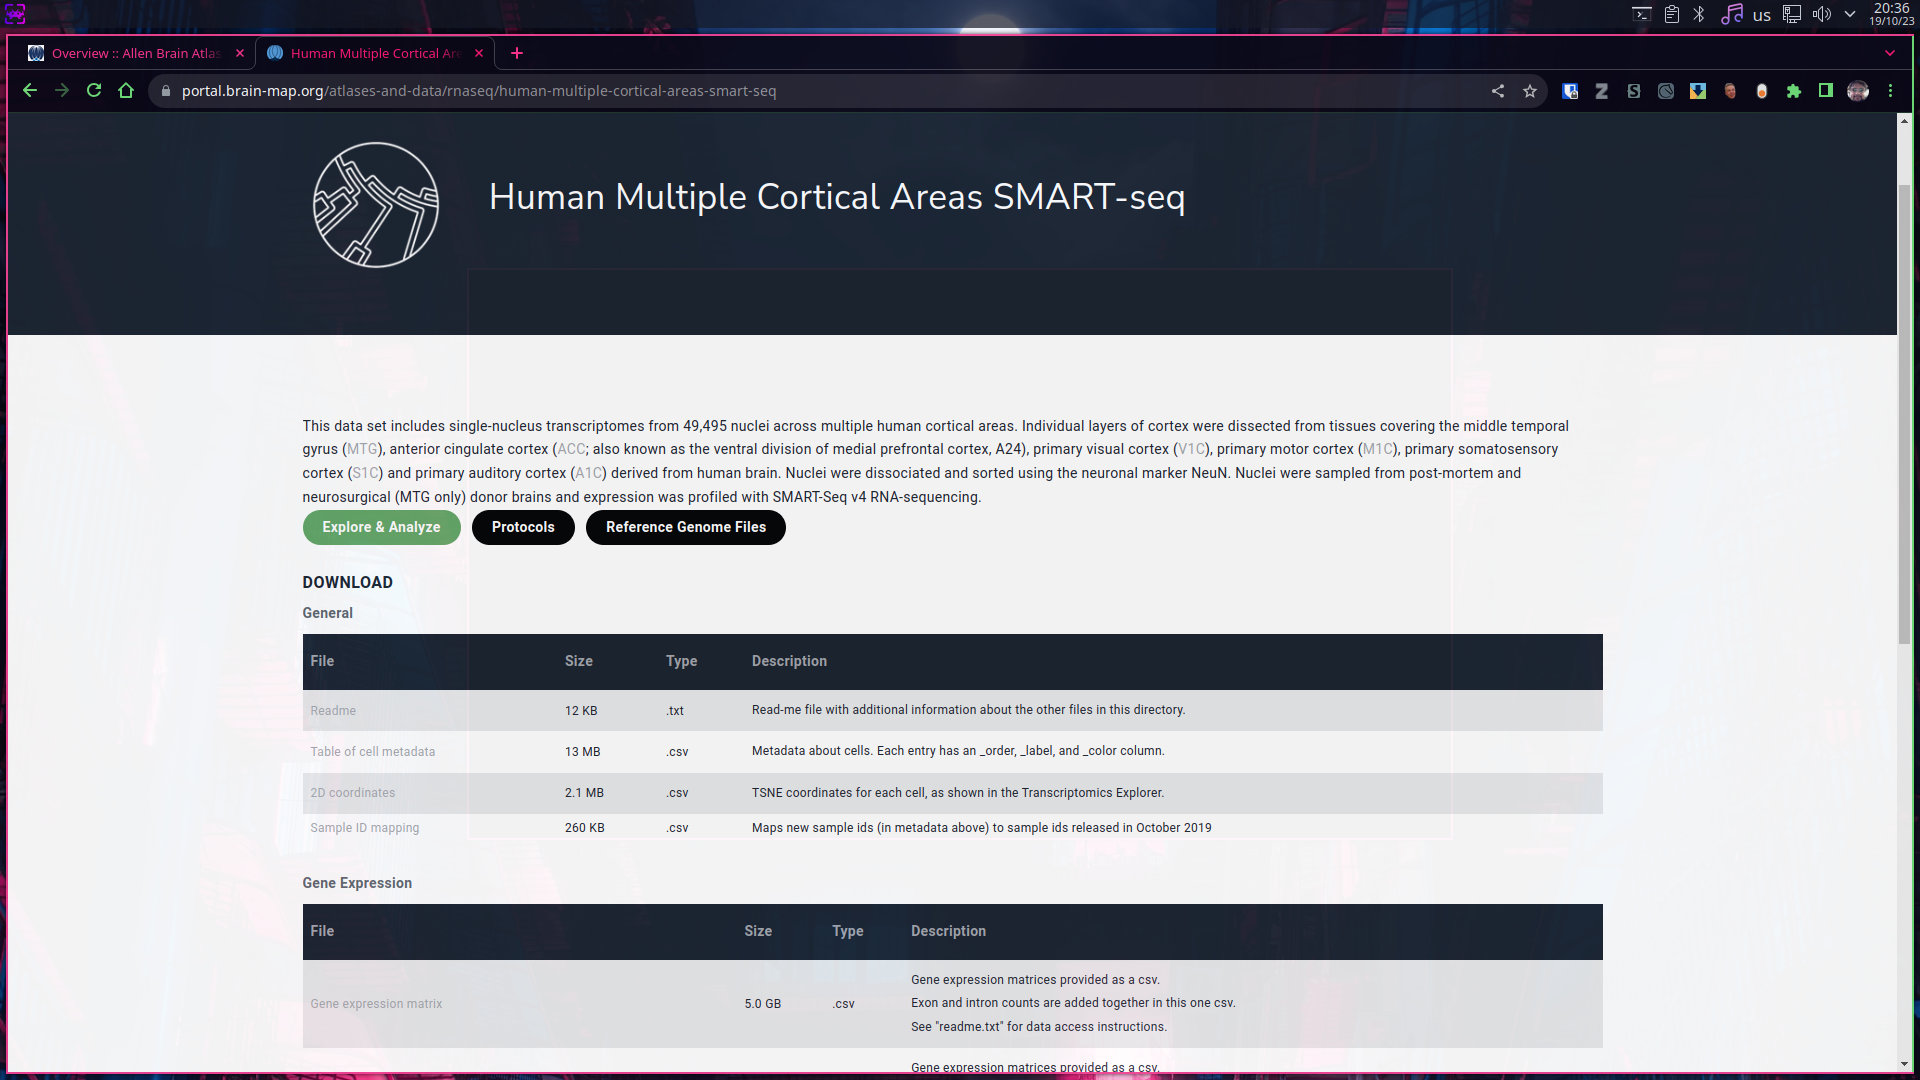
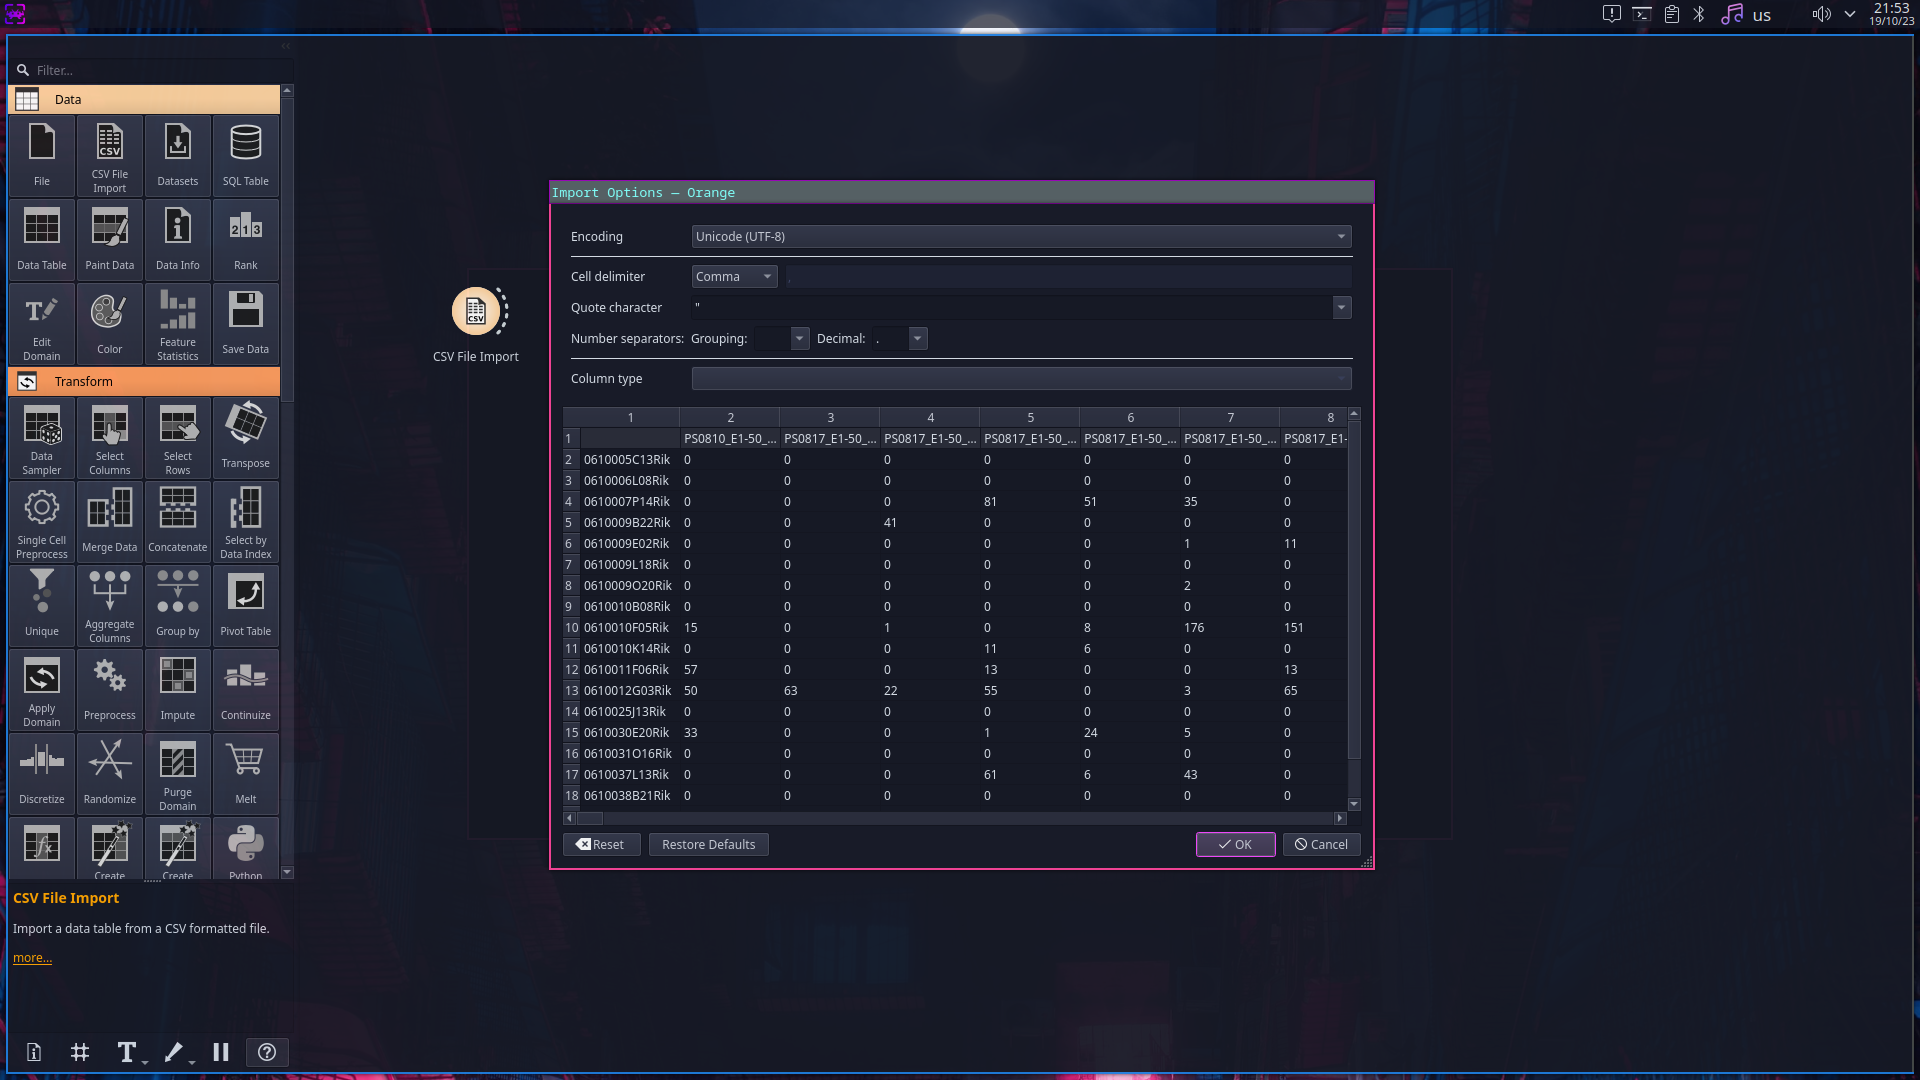
- Once on the download page we can select which files to download depending on our specific needs, for example; to create a basic attempt to separate cells into cell types, we could start by downloading the gene expression matrix, which is a comma separated tabular file that can be opened on text editors (such as notepad) or in spreadsheet software (as in Microsoft Excel)
Note: There is unadvisable to open and handling genomic data on offimatic software such Microsoft Office, not only because this kind of data tends to be very large in size, which often is not handled correctly by such programs but also because there is a lot of “autocorrection features” that tends to modify this kind of files even without user consent.
We recommend to open this kind of files with a simple text editor or even with LibreOffice Calc.
-
Another great way to visualize and explore this kind of data is using Orange which is free and open source software running over a Anaconda installation.
-
There is an informative supplementary file on the previous webpage on how to build an Orange Conda environment.
-
However easy to use: Orange can use quite a lot computing resources, be patient.
-
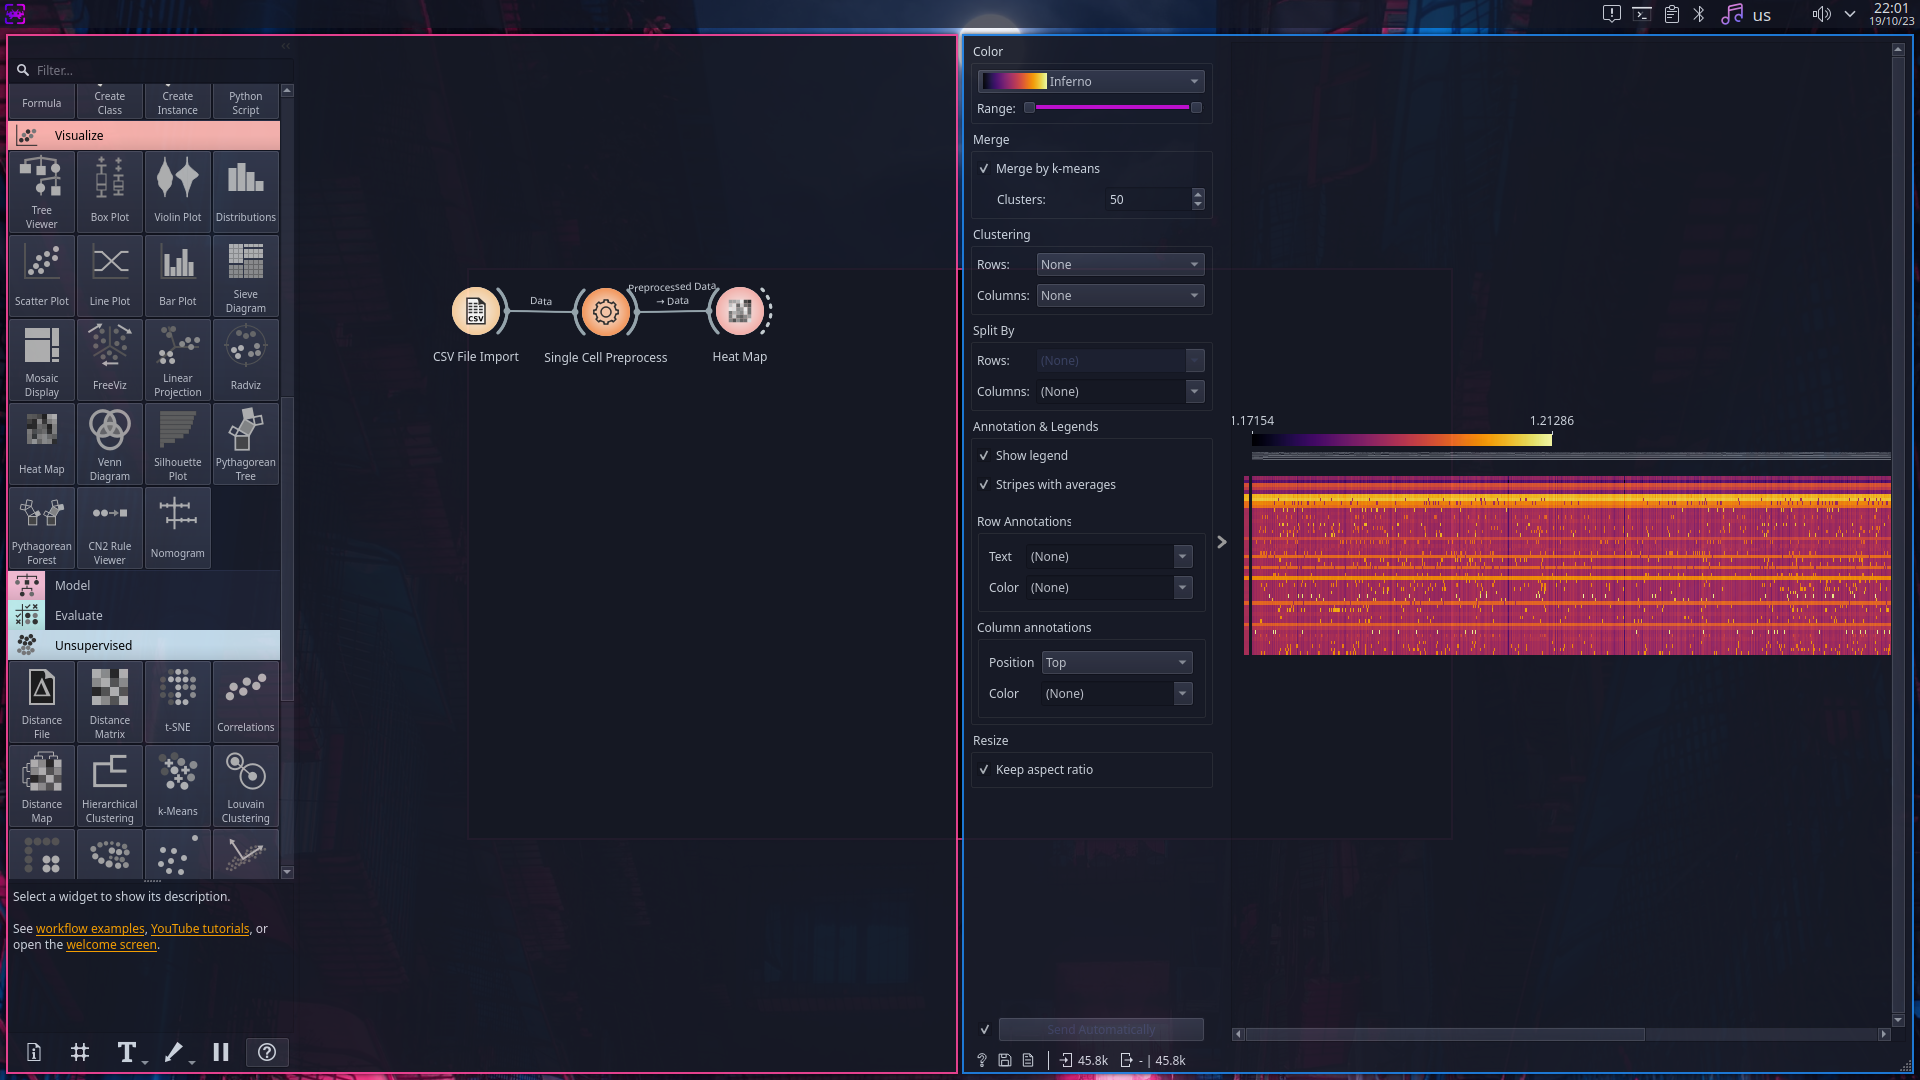
Orange is a great tool to visualize data, but still is advisable to filter data prior loading it to Orange, the following pictures come from a filtered dataset from the Allen Institute in which only “highly expressed genes” were kept.
-
-
With Orange we can load Data and create easy visualizations such spreadsheet like tables, heatmaps, and boxplots, however what make Orange unique is that all of that and many more is done by draggin blocks of functions into a digital canvas becoming a very visual experience, see pictures.

- Loading data is as simple as to open a file.
- There are many tools to preprocess data, including tools specifically designed to deal with biological data.
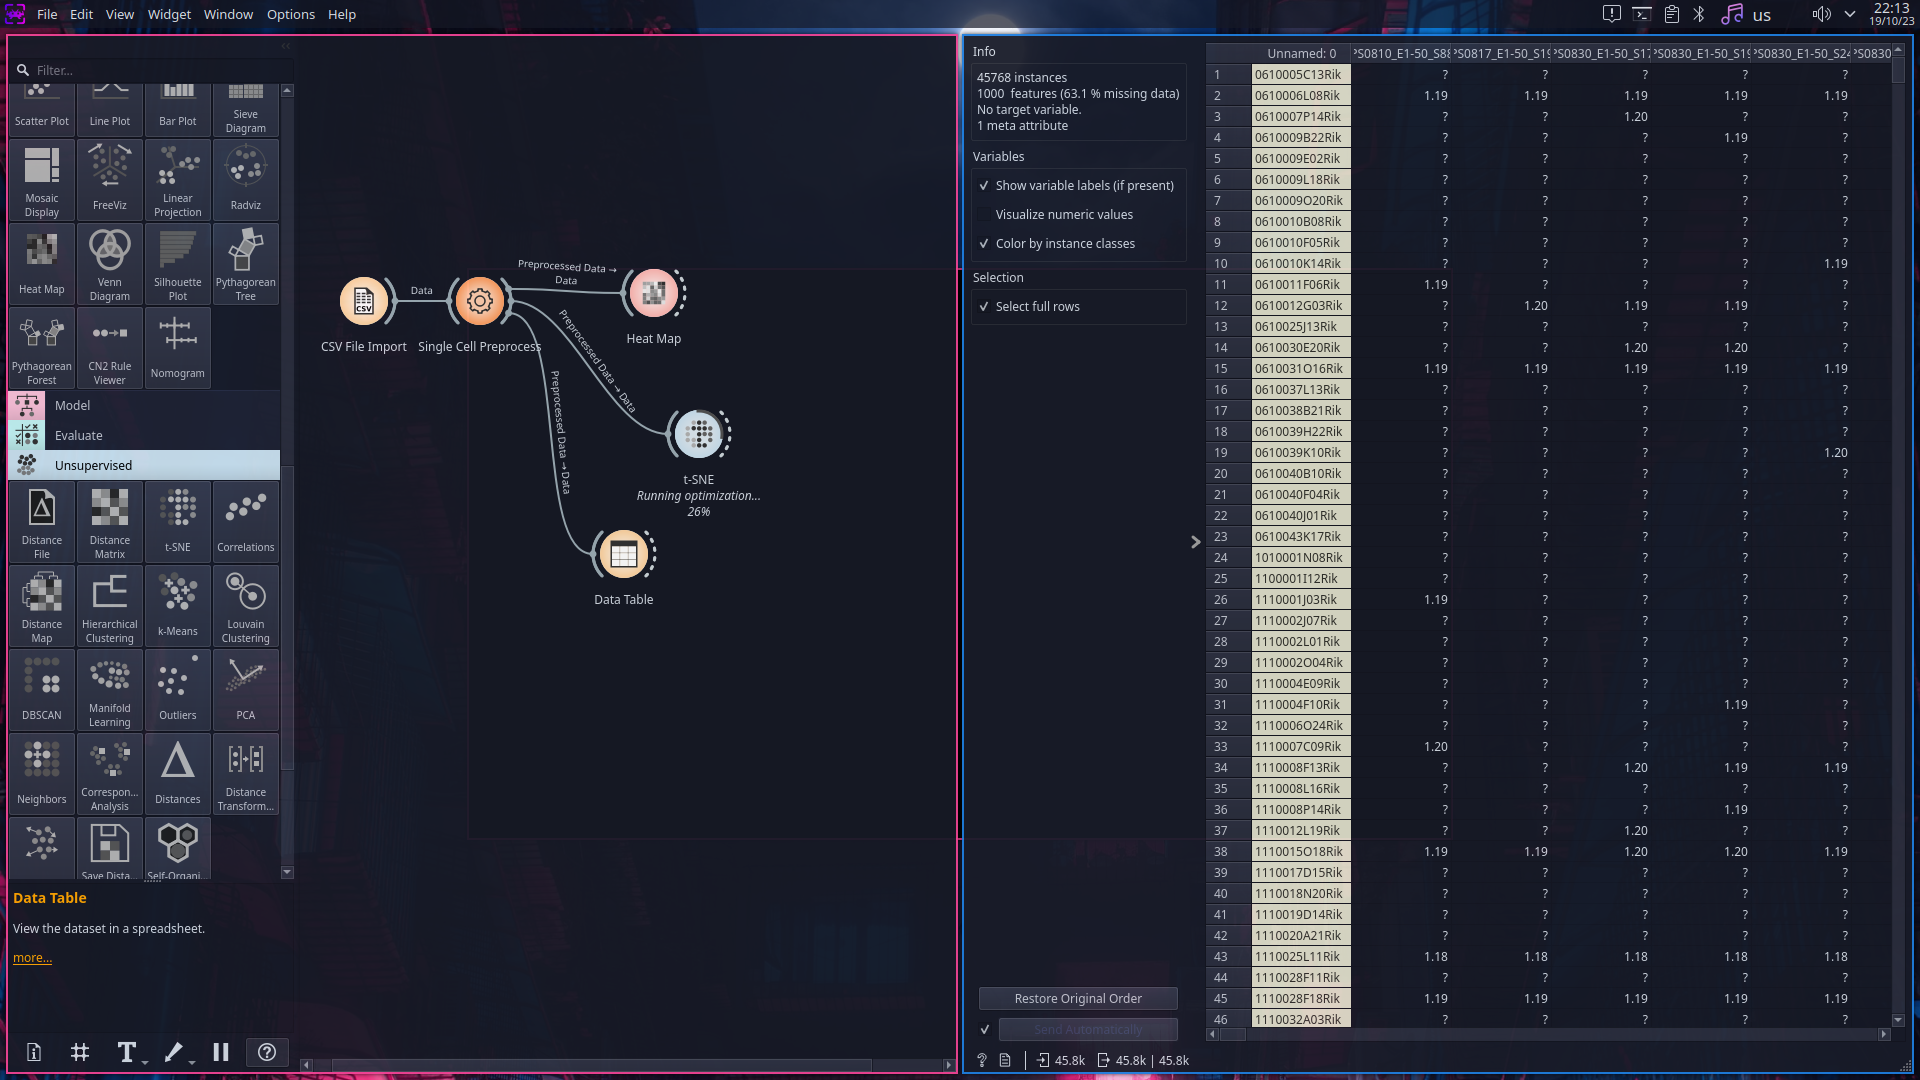
- We can find also tools to create easily plots and even run unsupervised machine learning algorithms.

Interactive Visualization of transcriptomic data (Allen Brain Cell Atlas)
- Open a web browser and navigate to: https://portal.brain-map.org/atlases-and-data/bkp/abc-atlas
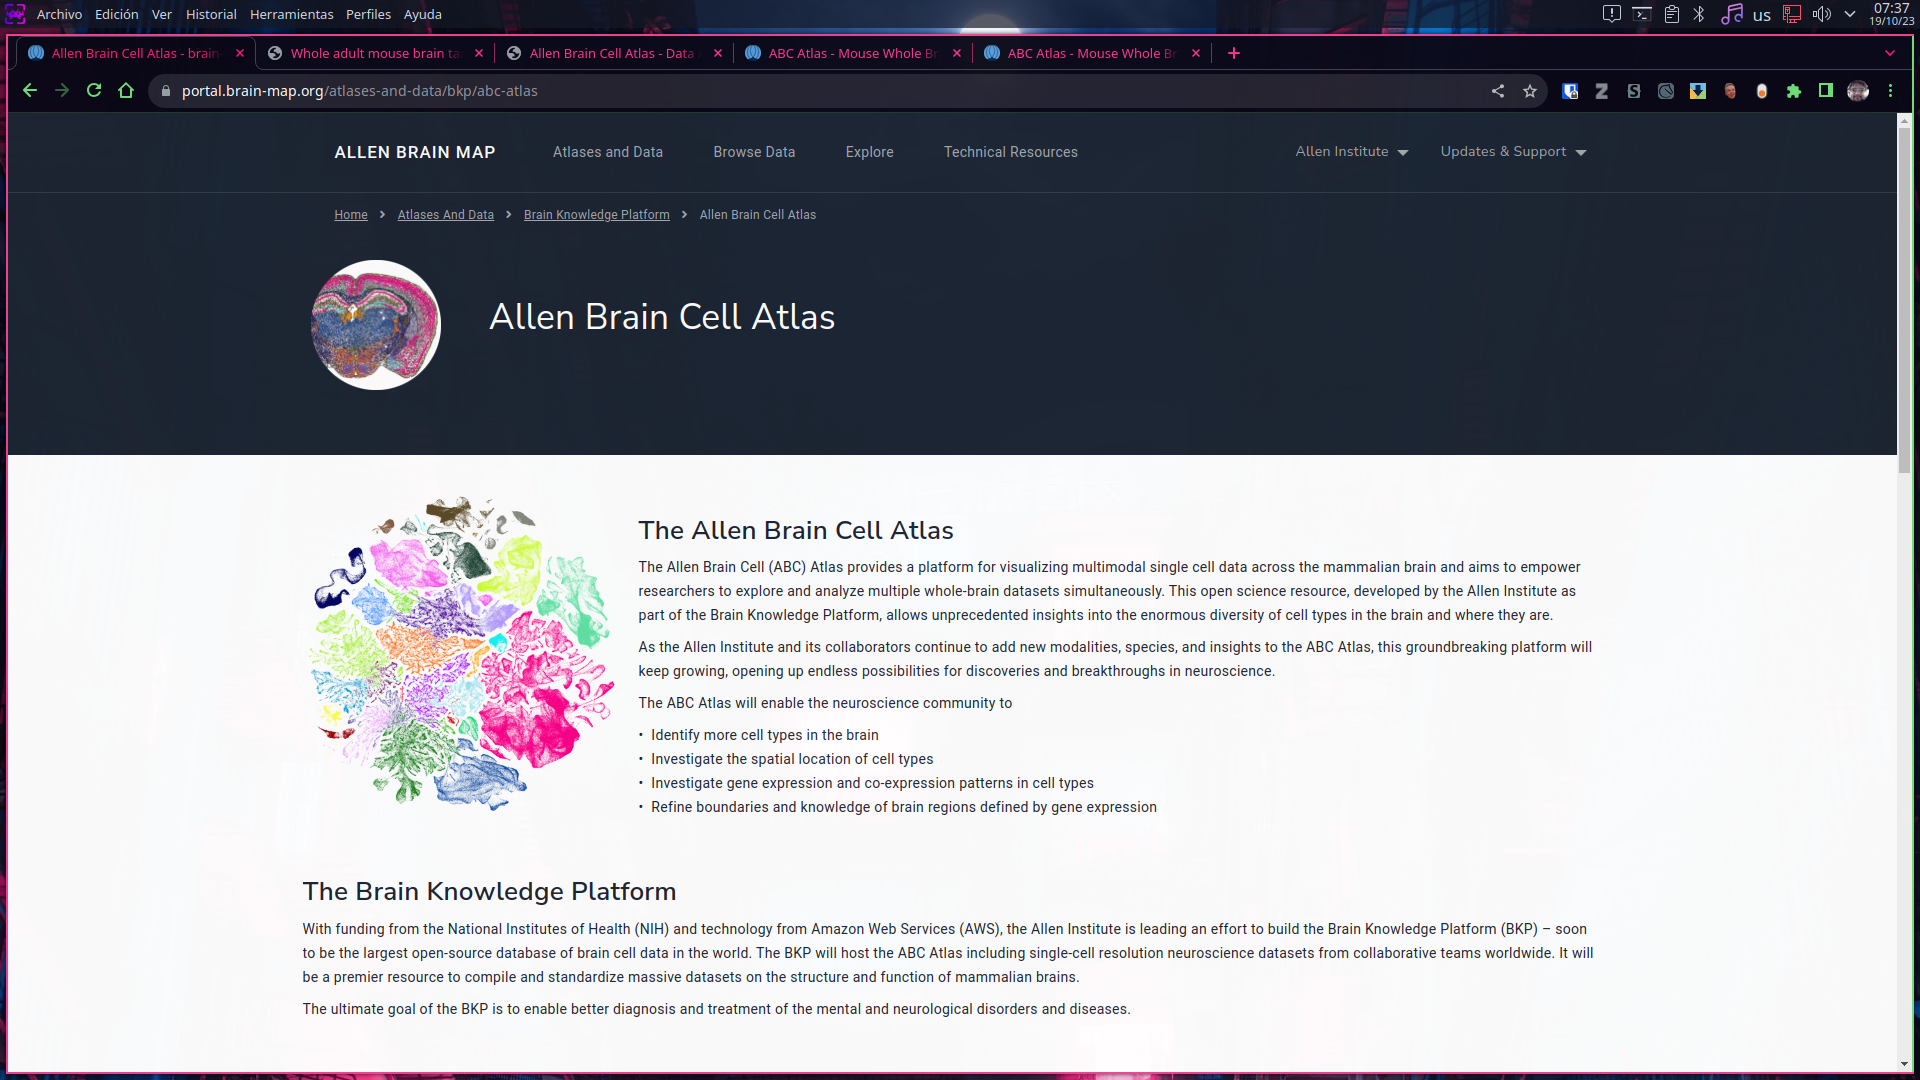
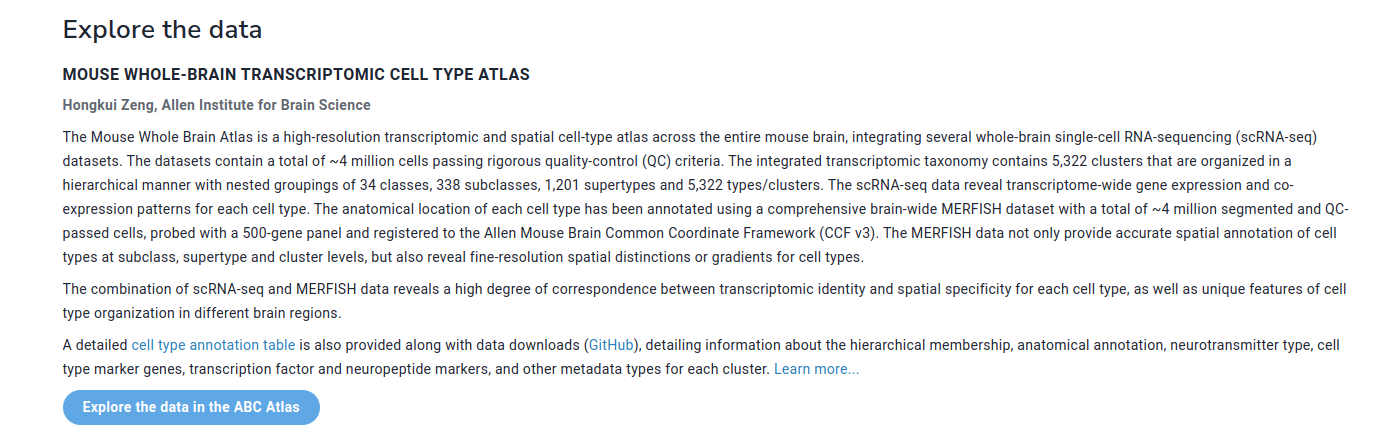
- Navigate down to the Mouse whole-brain transcriptomic cell type atlas, then read all the important information regarding such datasets.
-
Now, before clicking into the “Explore the data in the ABC Atlas” section take a moment to follow the link that provide more information on the composition and methods to accessing datasets. By following said link you can access a very complete documentation on the data available on the website and Allen Institute servers. We are going to use such links on a upcomming step of this tutorial.
-
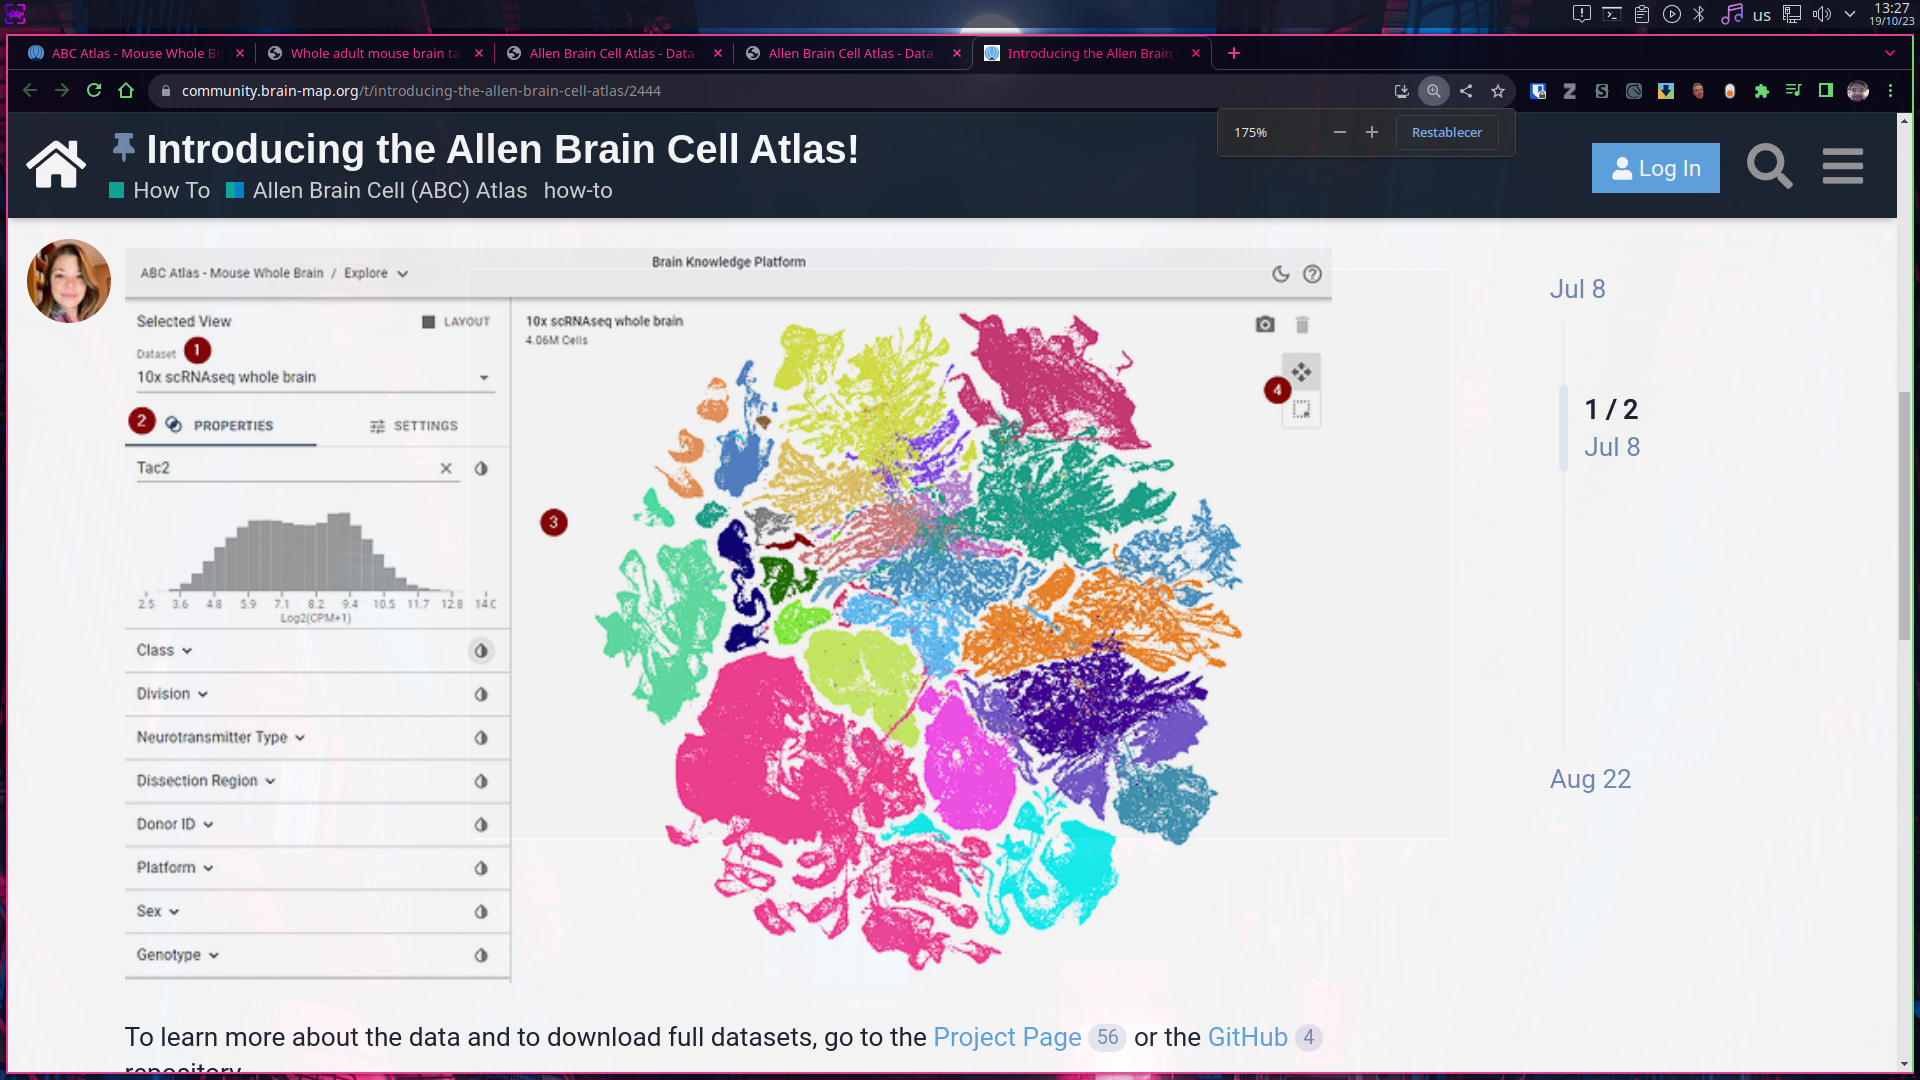
Enjoy the interactive experience on the online data visualizer.
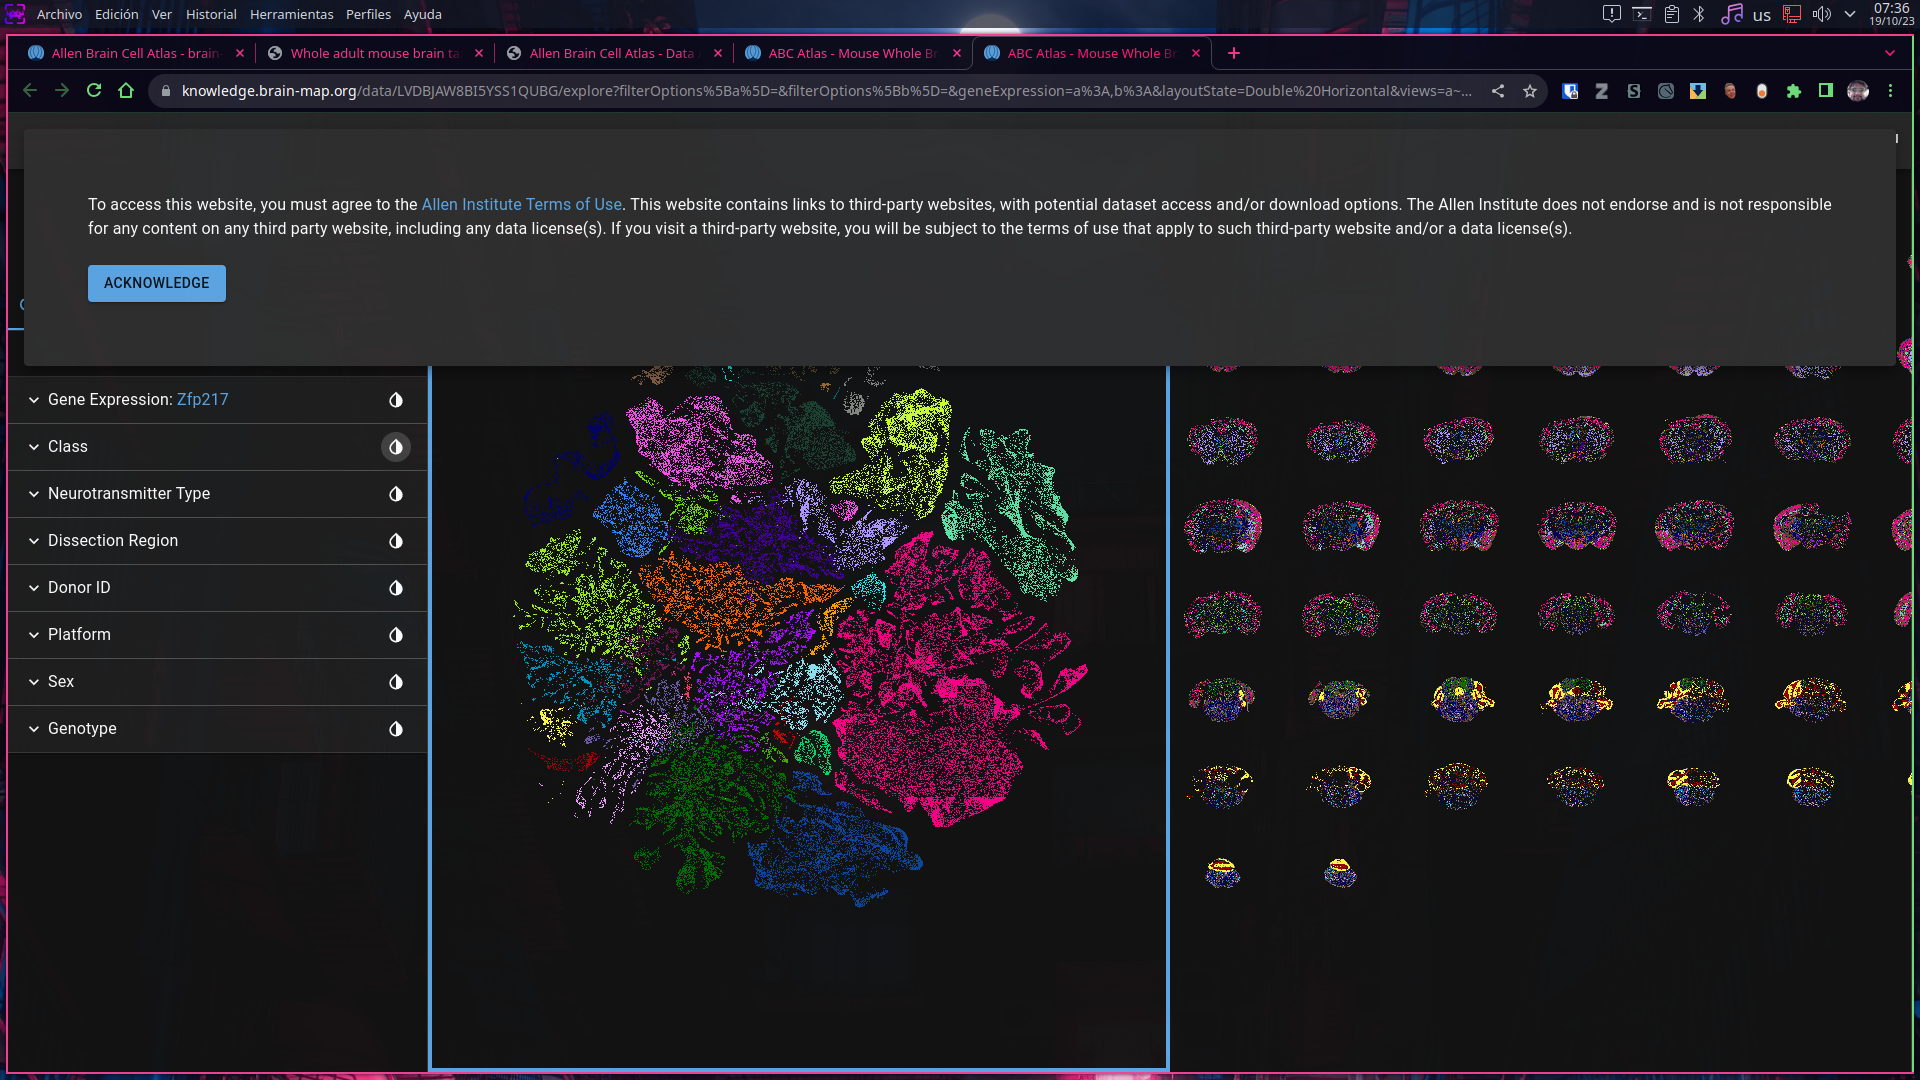
- Play changing the parameters for visualization on the tool bar at the left of the screen, however if this is confusing for you, you might want to take a look on the General User Guide
Downloading specific Allen Brain Cell Atlas transcriptomic datasets.
The web interface, however amazing and very useful, it can be either too simple or too complicated when we are trying to explore very specific data, and it can result more easy to deal if we download only the specific data that we need.
The Allen Institute provides a comprehensive guide to access the data, the following lines uses web links that are listed on such guide. We encorage you to explore thoroughly the official guide.
Being such gigantic datasets, we cannot simply download all the files at once, for that purposes in this guide we will use direct download links to access data, however there is a [recommended procedure] (https://alleninstitute.github.io/abc_atlas_access/notebooks/getting_started.html) to navigate datasets content using a Python Notebook.
- To get data we can start our search at the getting started webpage for the Allen Institute github repository.
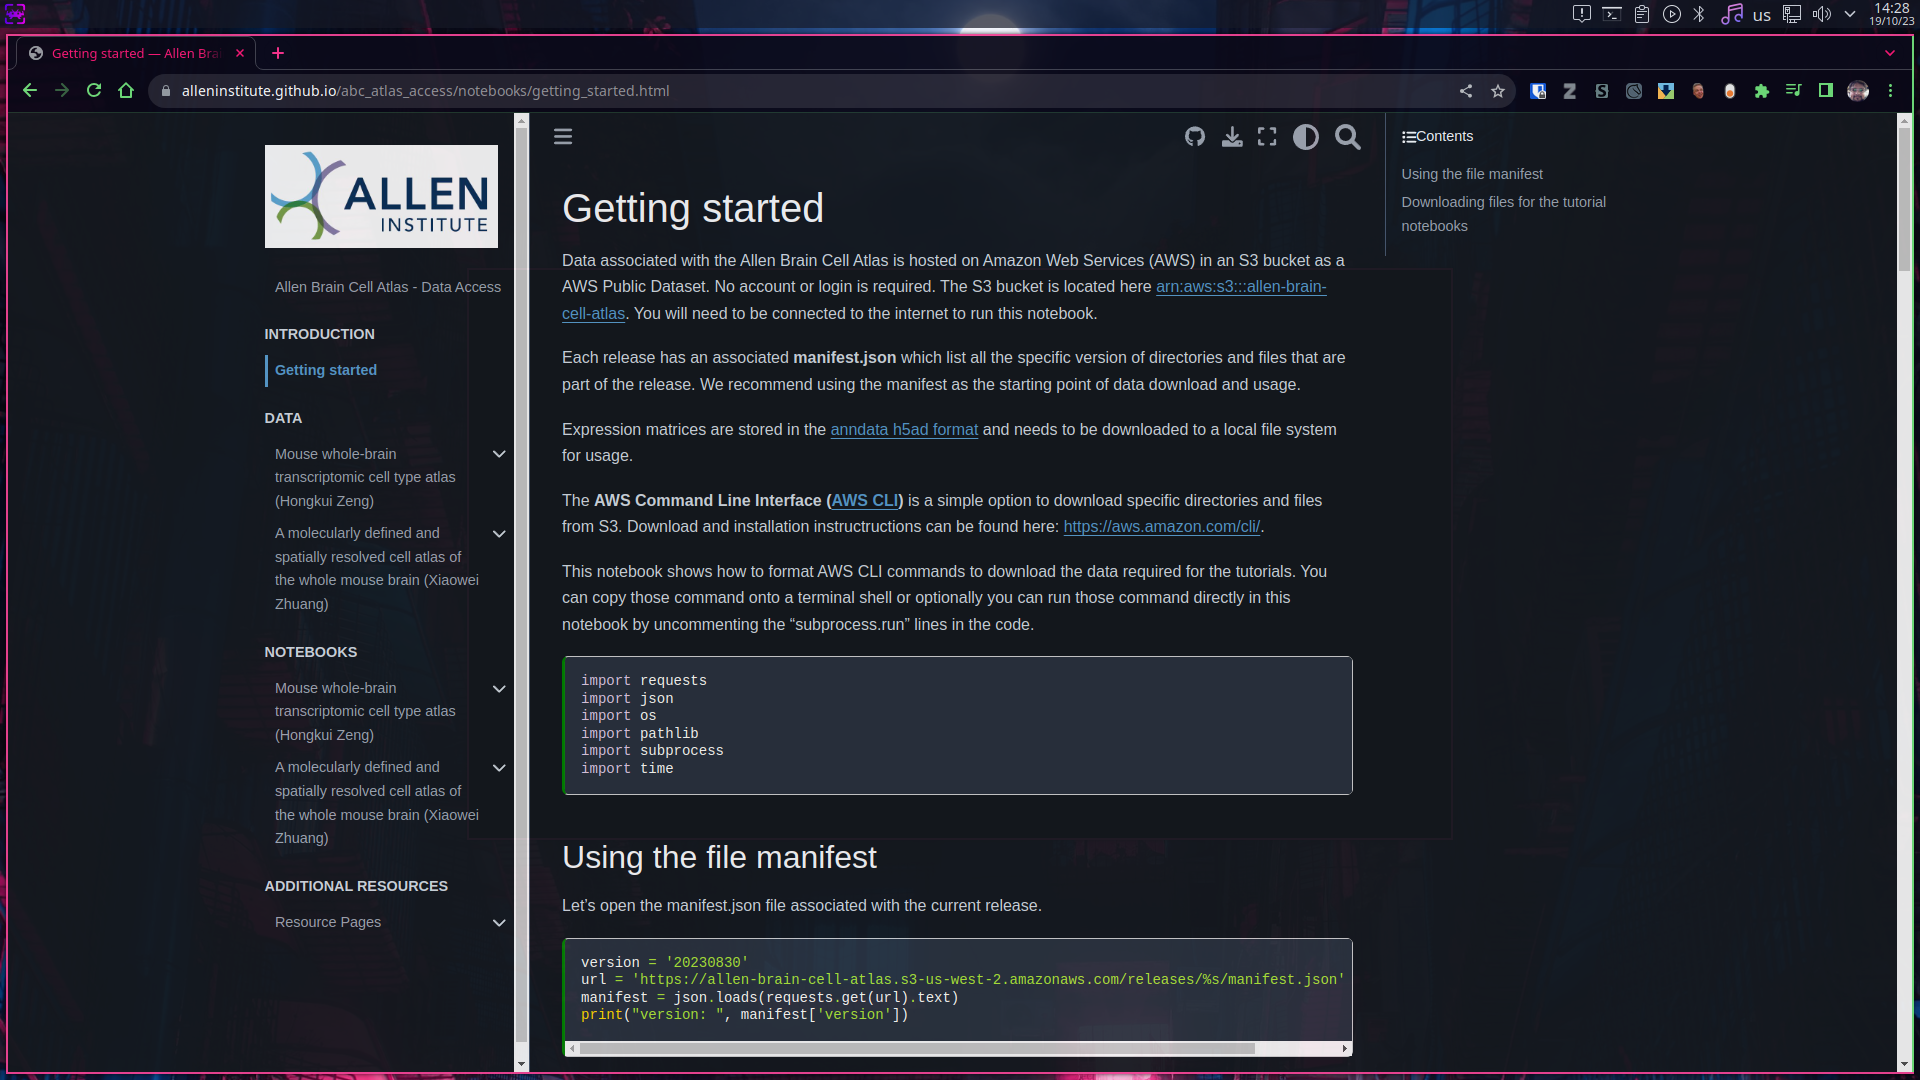
- On the left side of the screen we can see listed different links to information for the datasets (1), by following such links we can also find the data to download. (2)
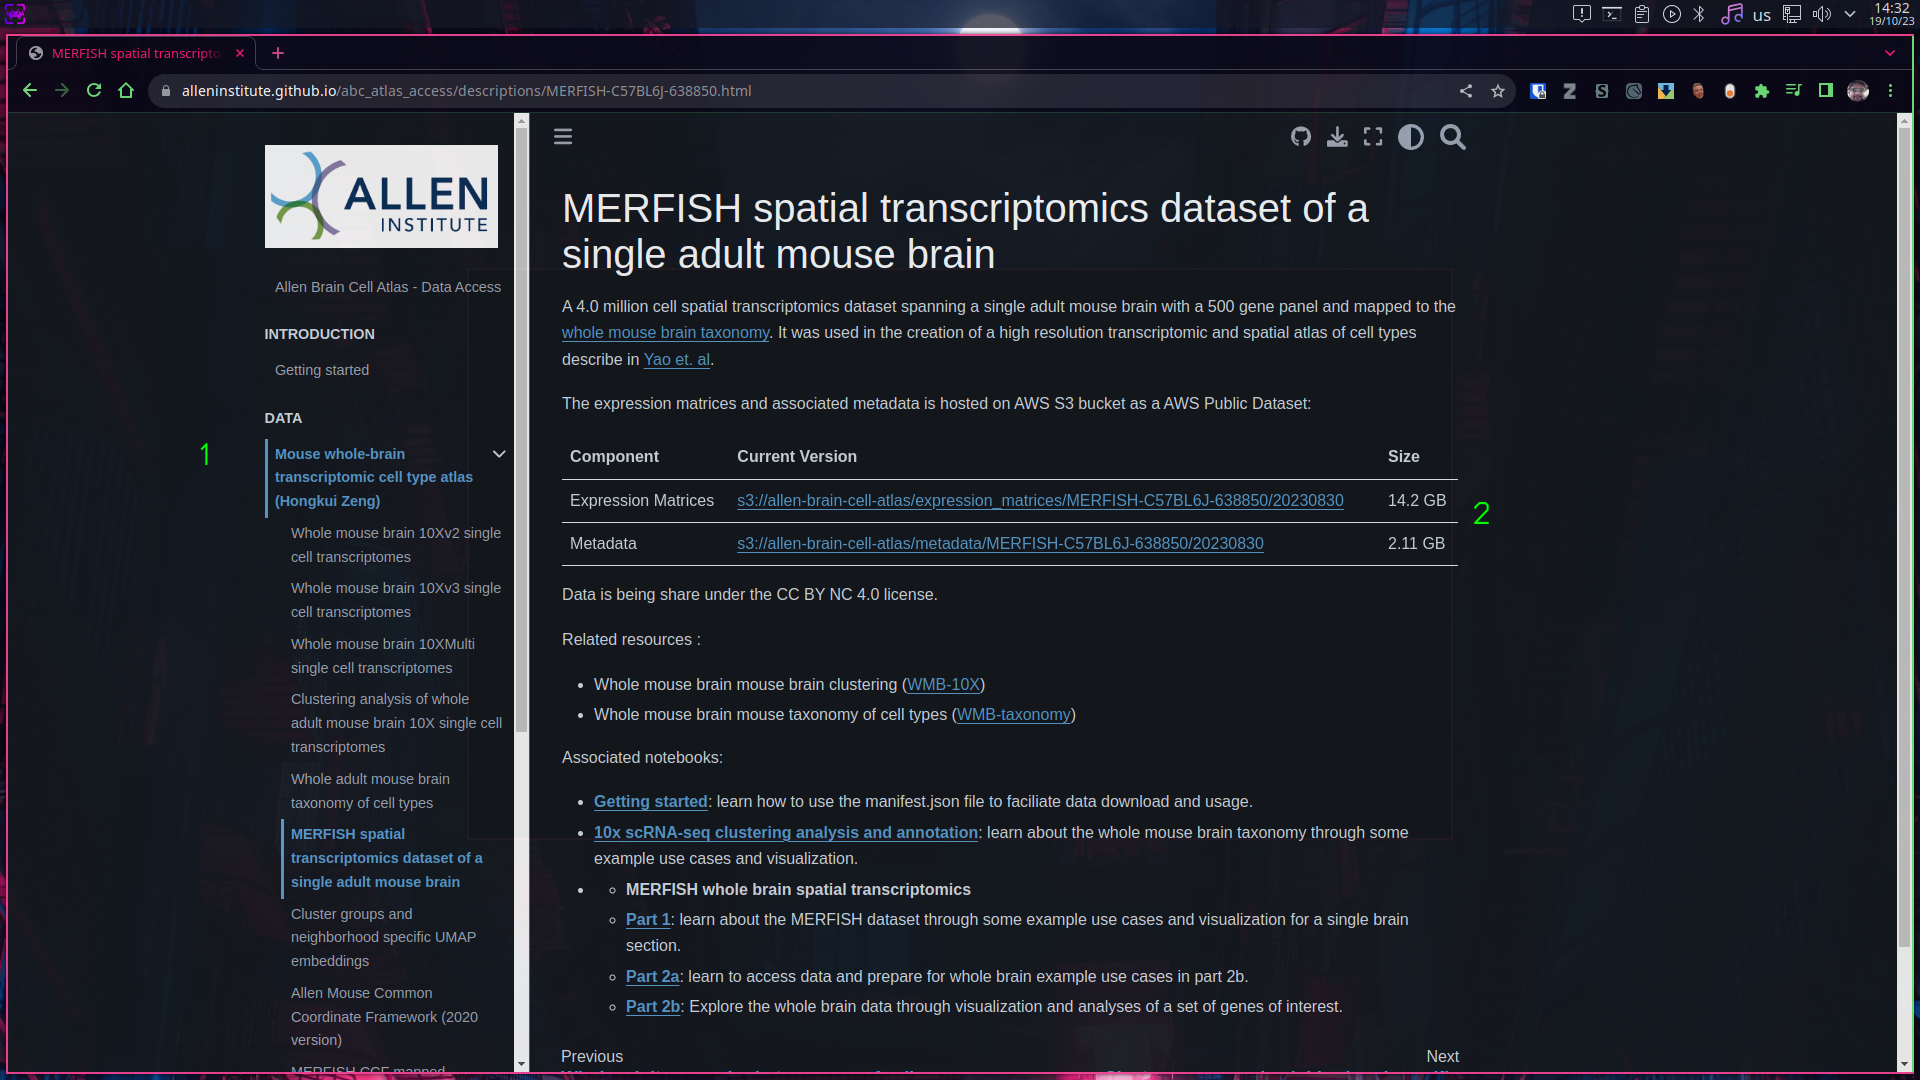
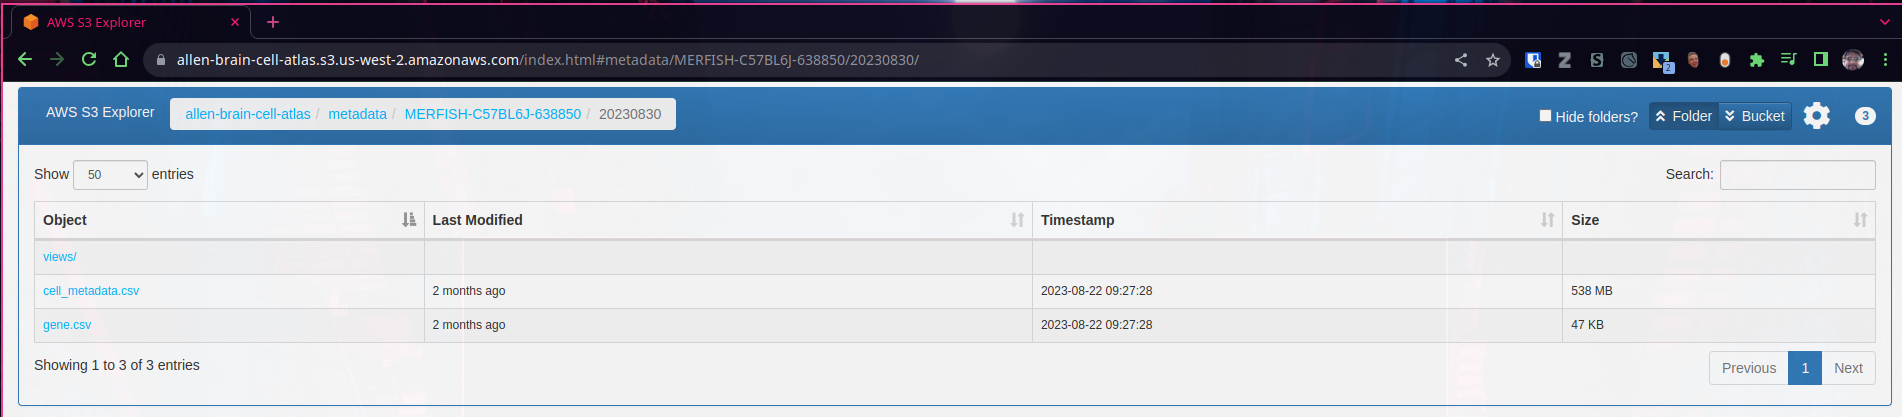
- For this guide we will download both the Expression matrices and the associated metadata. (see above screenshot), by clicking into their respective links we can finally find the download link for such dataset. For this particular example (see picture below) we can download both raw data matrices or matrices that have been transformed using log2.
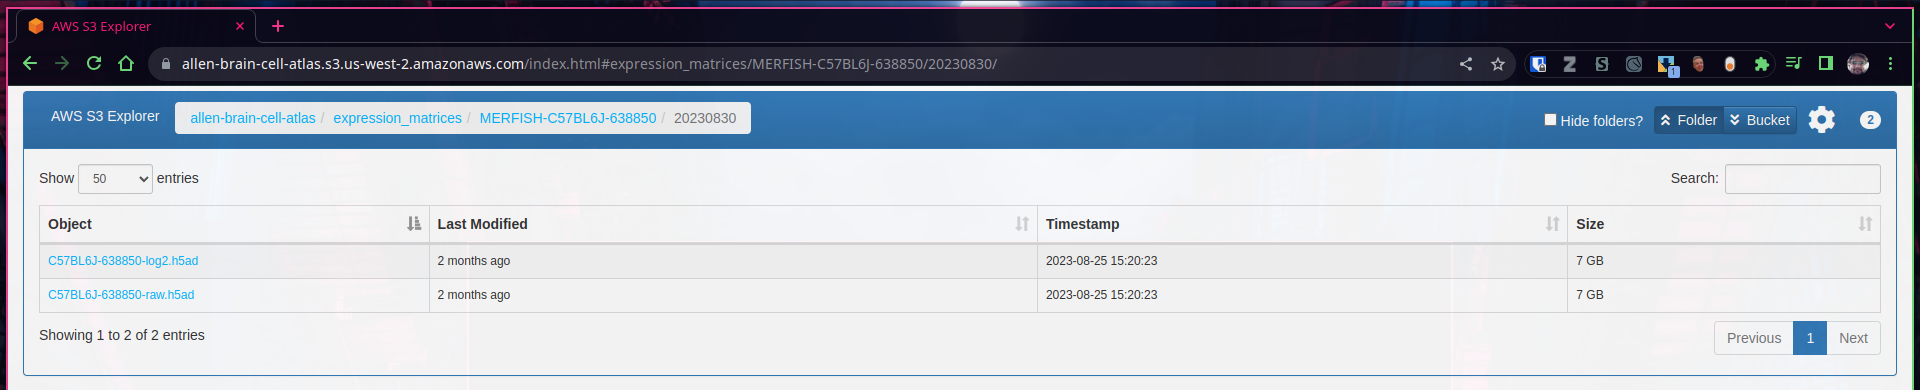
- The downloaded data files are in H5da format, which can be opened and visualized using programming languages such R or Python.
Exploring Mouse Patch-Seq data.
Patch-sequencing is an exciting new technique that allows researchers to create a correlation between neuroanatomy with transcriptomics, across different experimental conditions.
- From the main webpage of the Allen Brain Map portal, we can click into “Explore Mouse Patch-Seq Data”, unlike the Allen Brain Cell Atlas webpage, (discussed above) this time clicking on the link take us directly to the interactive visualizer.
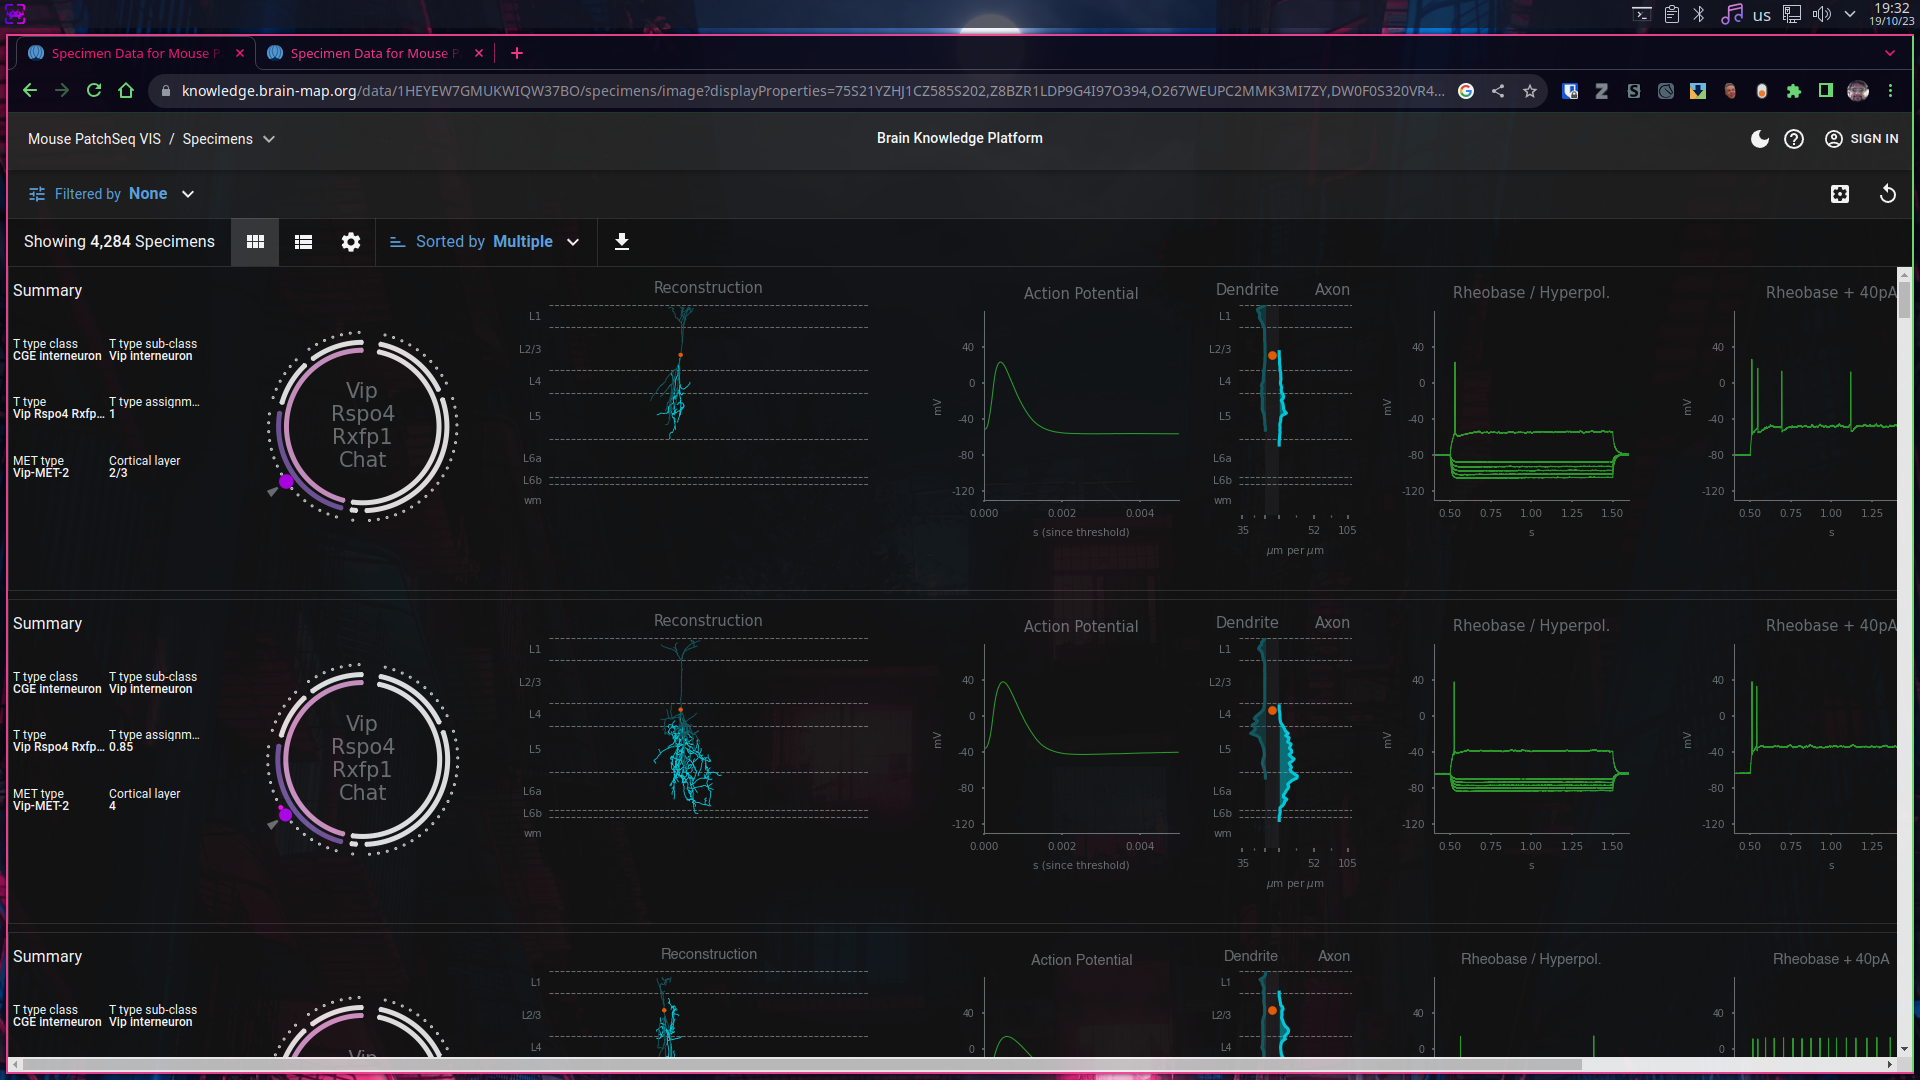
- Just as we did on the previous visualizer we can modify all kind of parameters to filter and modify the plots we are presented. Unfortunately there is no easy way to access documentation for this tool.
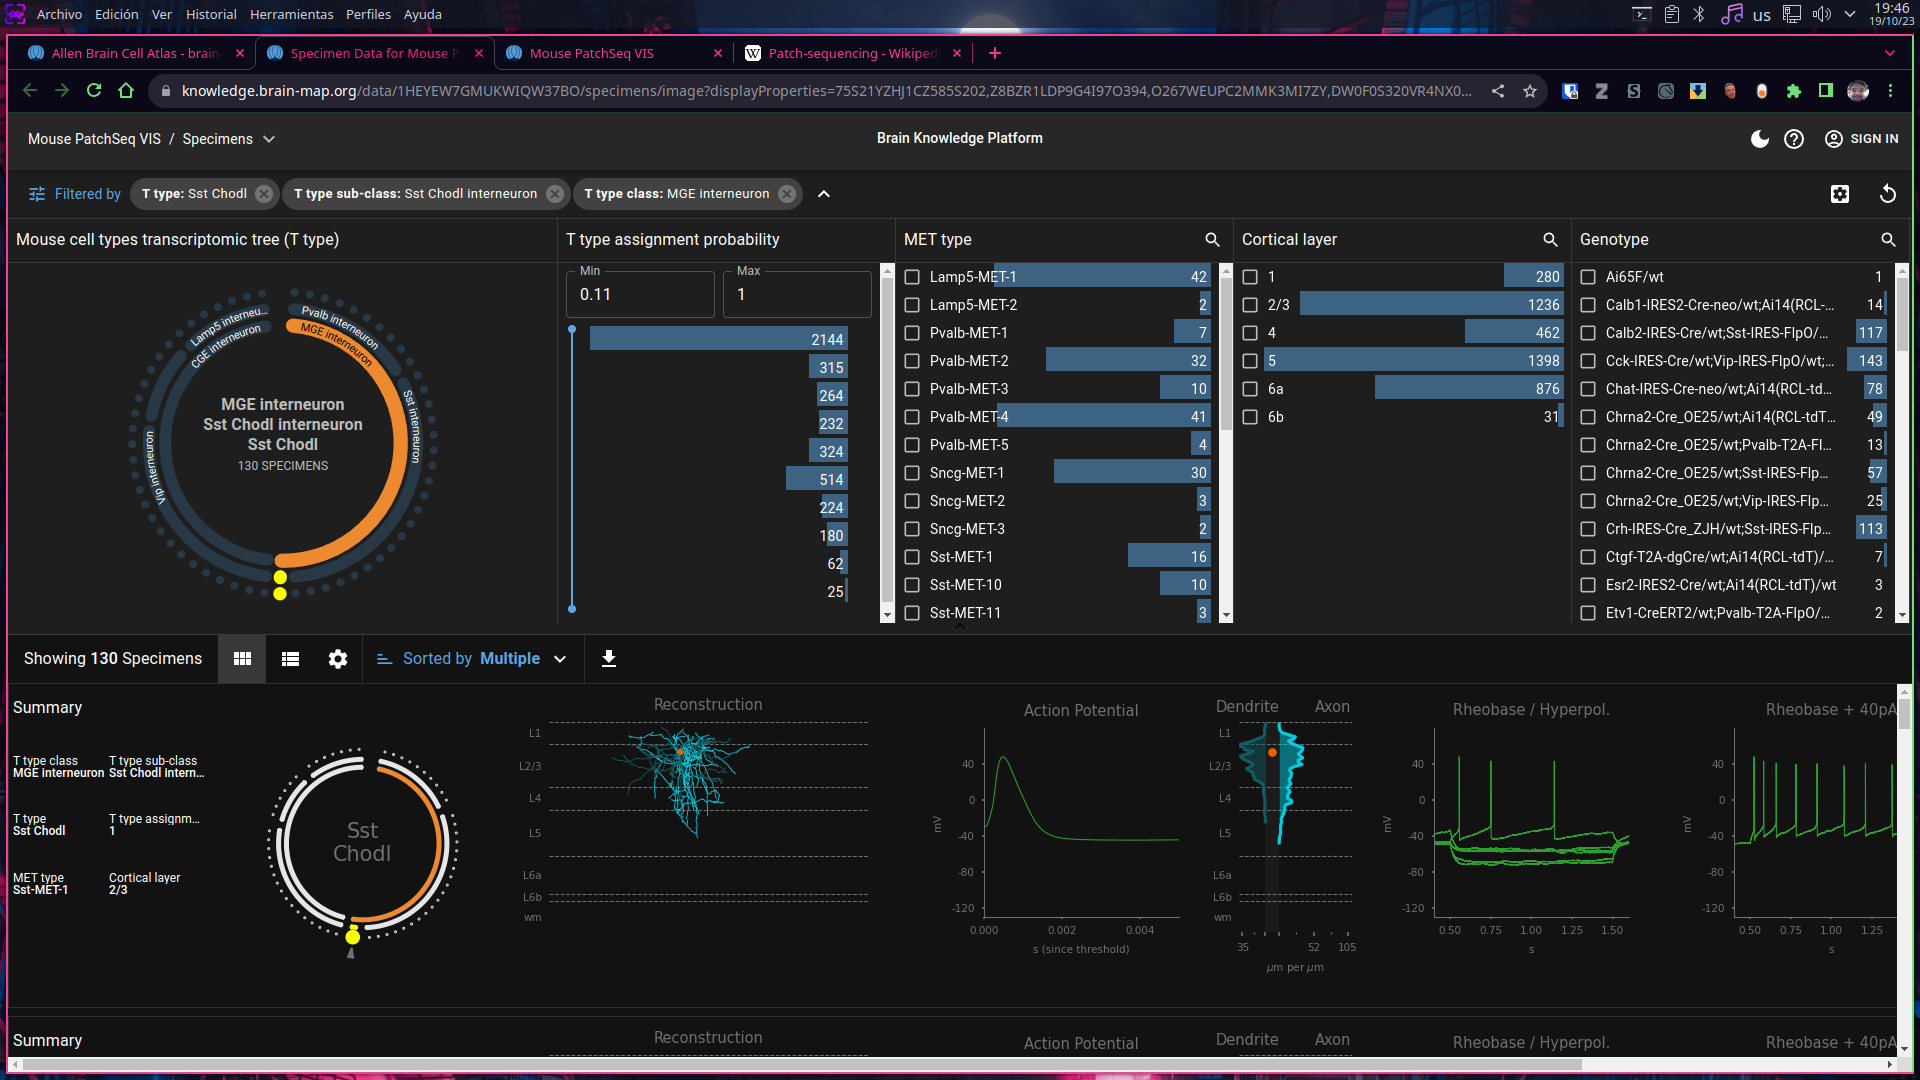
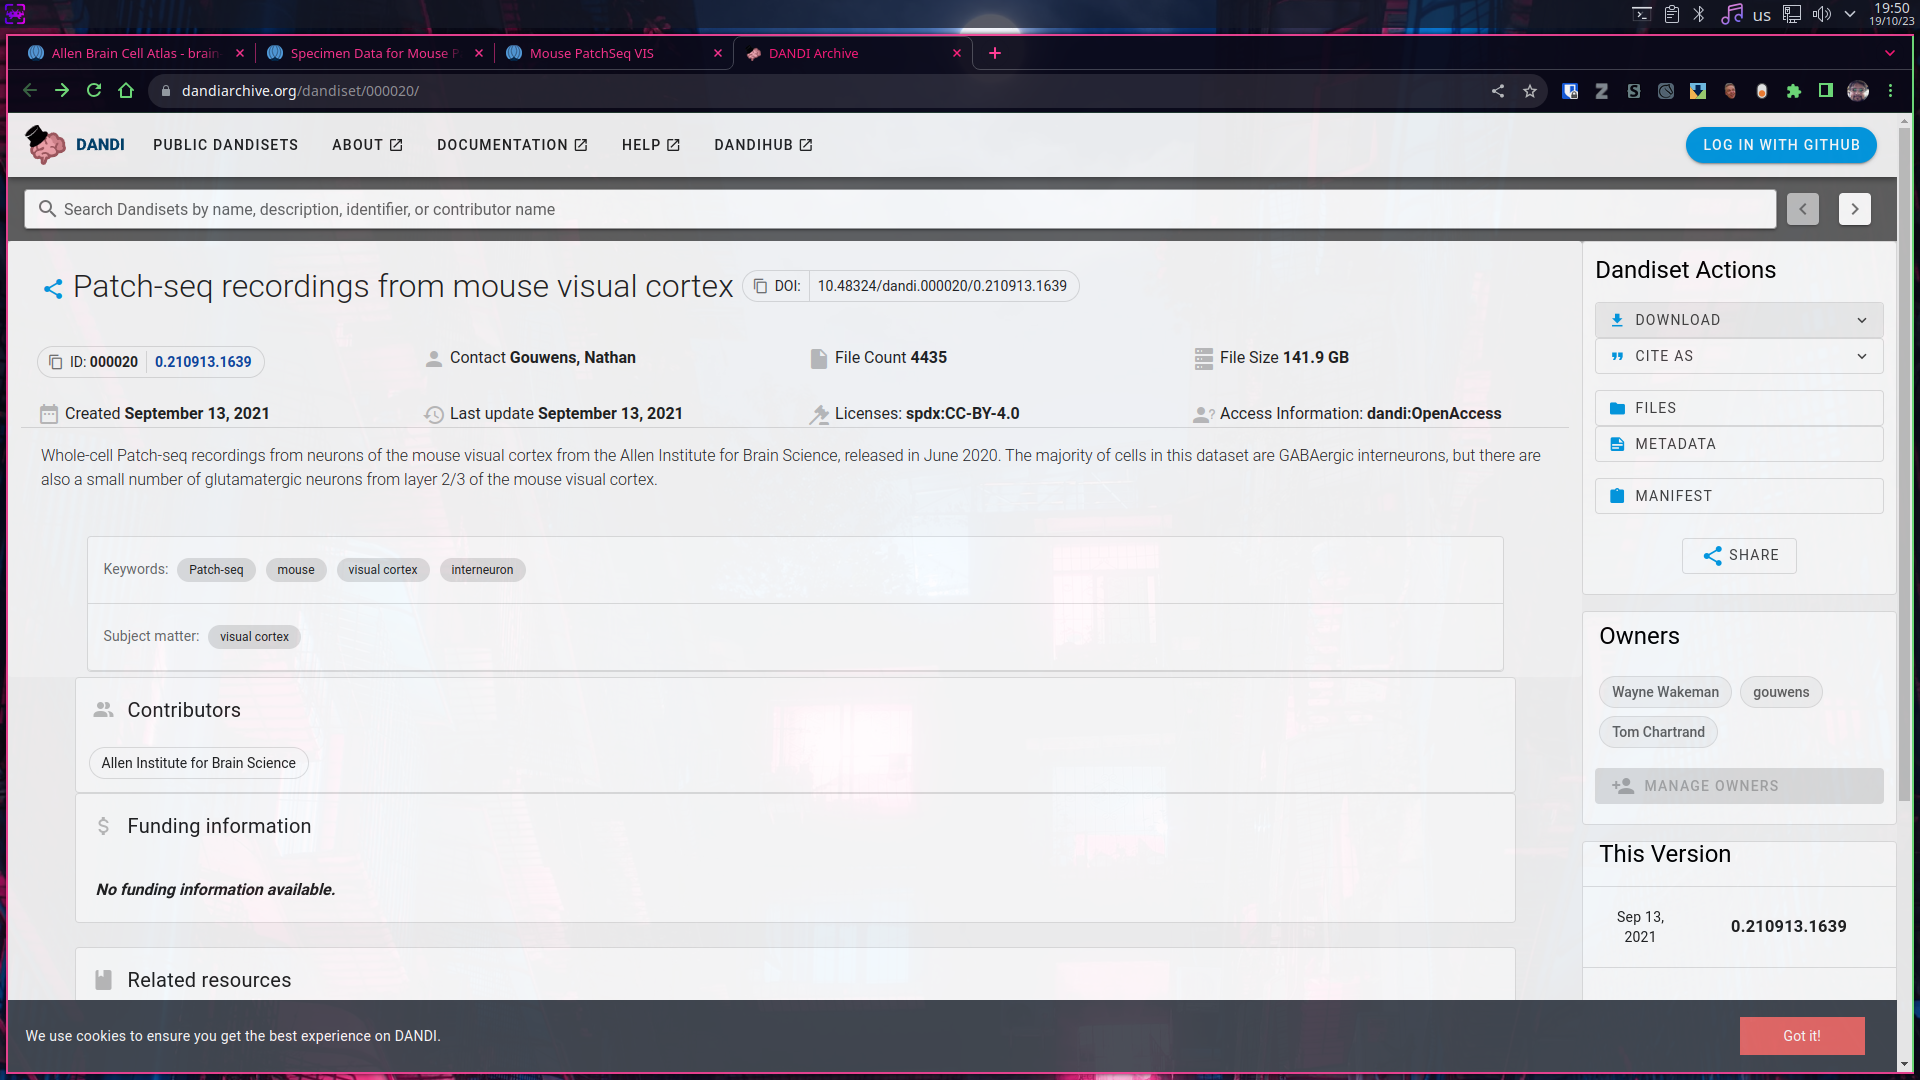
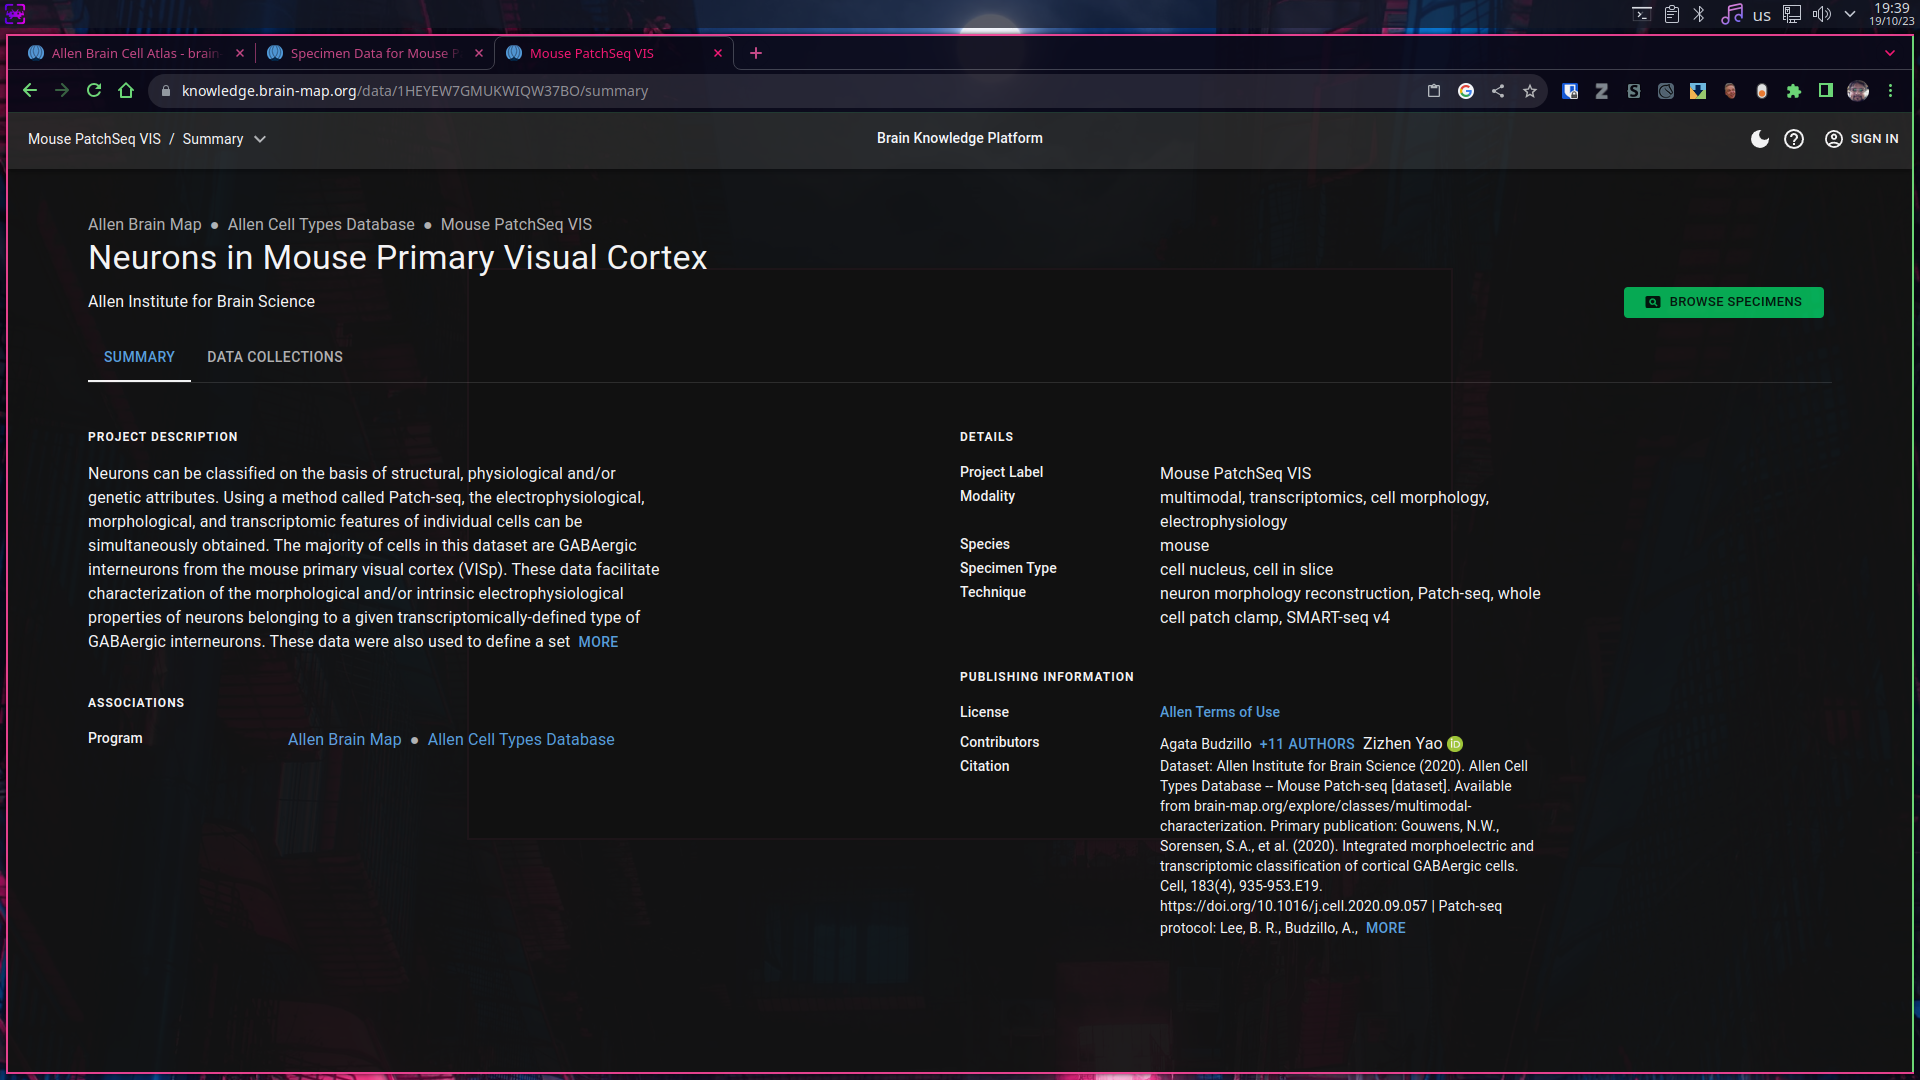
- To discover what is shown here as well the composition of the dataset, we must conduct a simple web browser search for “allen institute patch seq” one of the first results, take us to the description of the dataset
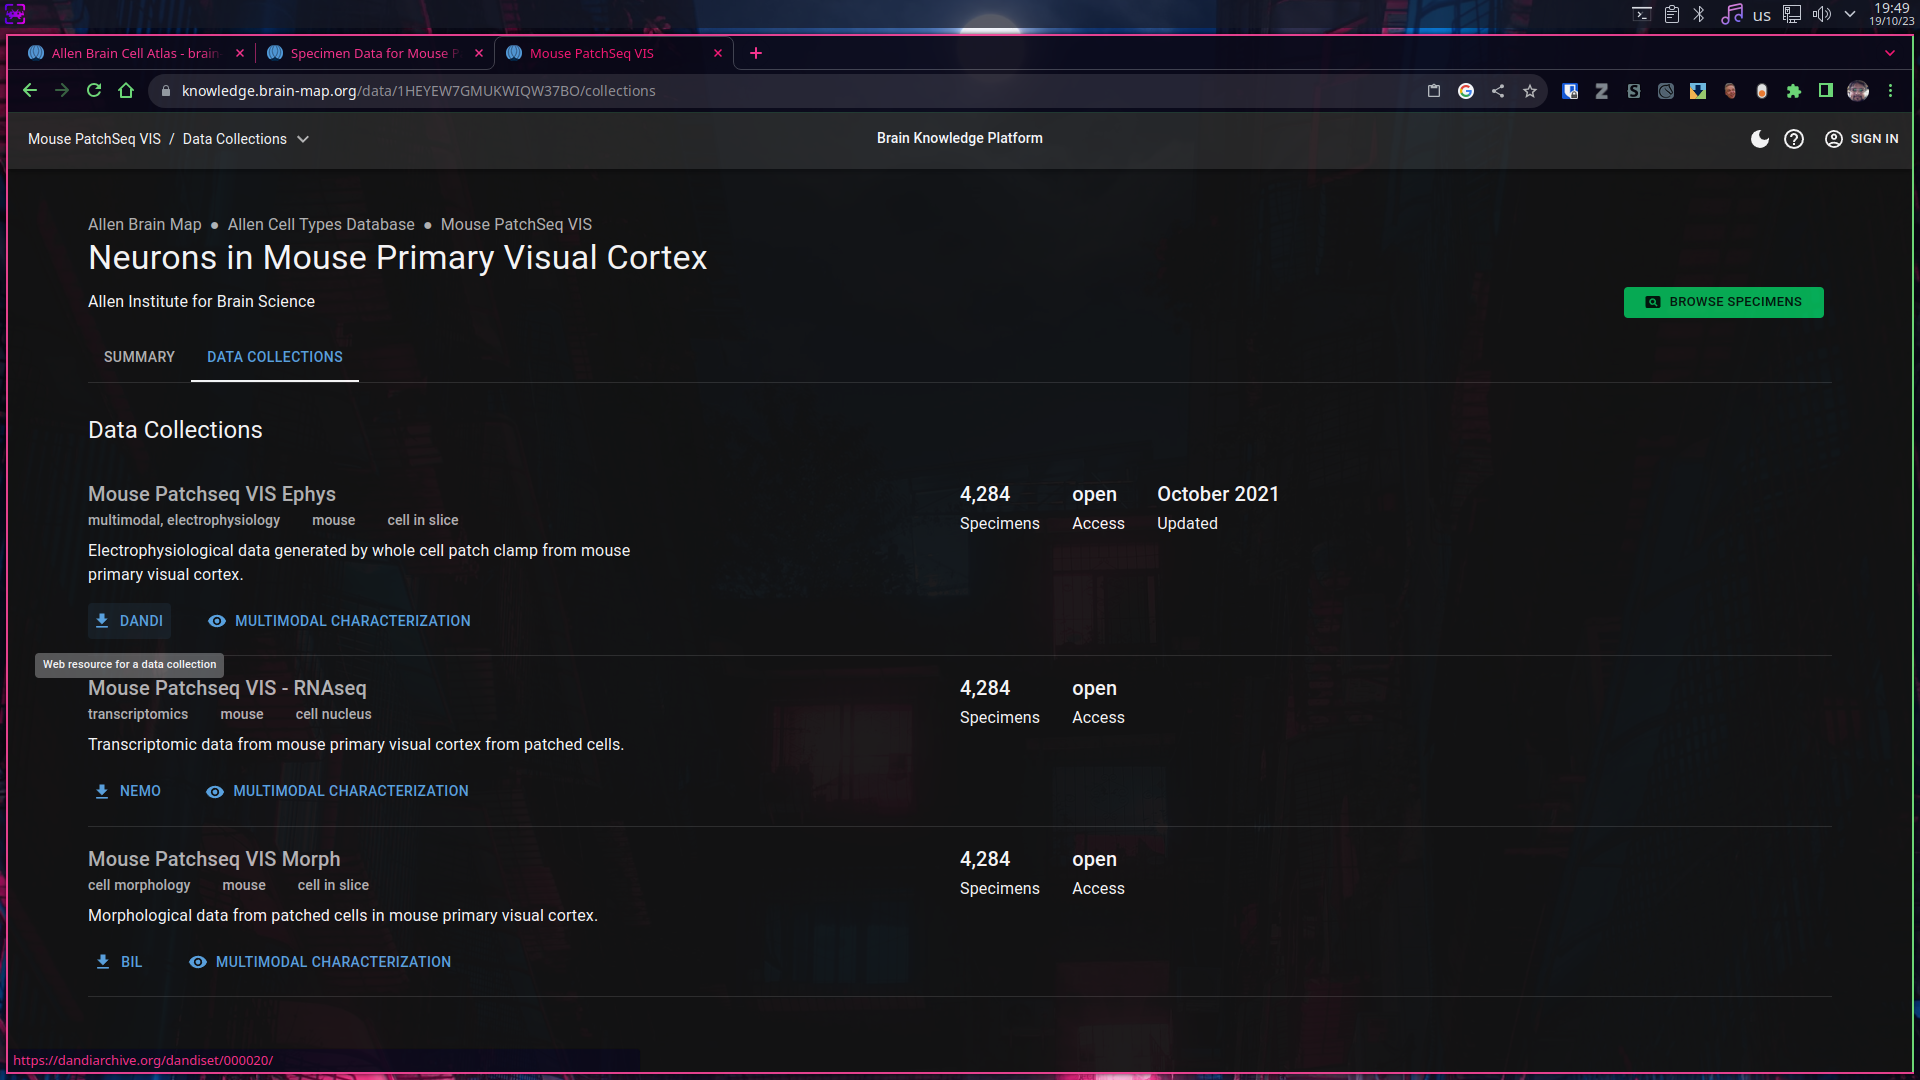
Downloading Patch-Seq data.
- Starting from the Patch-Seq dataset description webpage, clicking into “Data Collections” will shown links towards the download website.